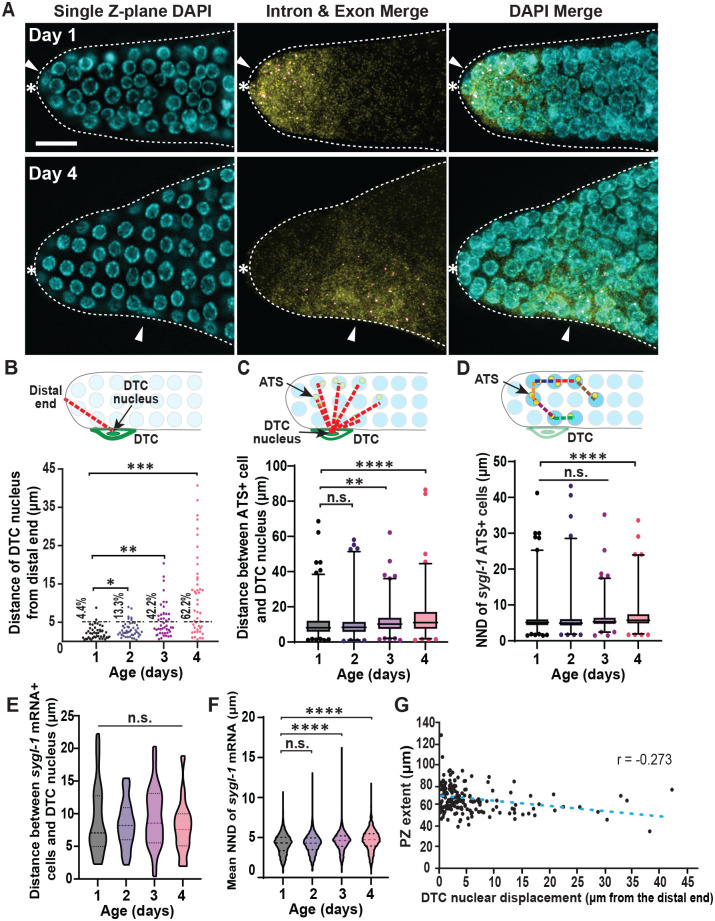
Fig. 4.
Notch activation occurs near the DTC/niche nucleus regardless of the aging stage. (A) Representative sygl-1 smFISH images of Days 1 and 4. Left: single z-plane DAPI; middle: intron and exon merge; left: DAPI, intron and exon channel merge. White arrowhead indicates the DTC nuclear position. White asterisk indicates distal end of the gonad. (B) A diagram illustrating the Euclidean distance between the DTC/niche nucleus and the distal end of the gonad, indicating the amount of nuclear shift, are measured through aging. n=45 gonads for all ages. Error bar: the standard deviation. Black dashed line indicates the boundary where majority of the DTC nuclei reside in Day 1. Percentages listed are the number of gonads with DTC nuclear position that exceed the boundary (∼5 µm). (C) A diagram demonstrating the quantification of distance between the sygl-1 ATS-containing cells and the DTC/niche nucleus, estimating the clustering of Notch activation to the nucleus through aging. For all box-and-whisker diagrams in this study, the middle line shows the median; top and bottom of box are the third and first quartiles, respectively; whiskers, maximum and minimum of data points; circles, outliers (value greater than 1.5× first or third quartile from the median). (D) The shortest distance between two neighboring cells that contain at least 1 sygl-1 ATS (the nearest neighbor distance, NND) are shown for all ages. (A–C) n=621, 460, 508, and 444 ATS for Day 1, 2, 3, and 4 respectively. (E) The distance between the cells containing sygl-1 mRNAs above the basal level and the DTC/niche nucleus. (F) The nearest neighbor distance (NND) of cells with sygl-1 mRNAs above the basal level. (E,F) n=5462, 3913, 4856, and 5256 nuclei for Day 1, 2, 3, and 4 respectively. (G) A linear regression plot of the progenitor zone extent and the DTC nuclear shift from the distal end of the gonad for all ages. n=180 gonads.

