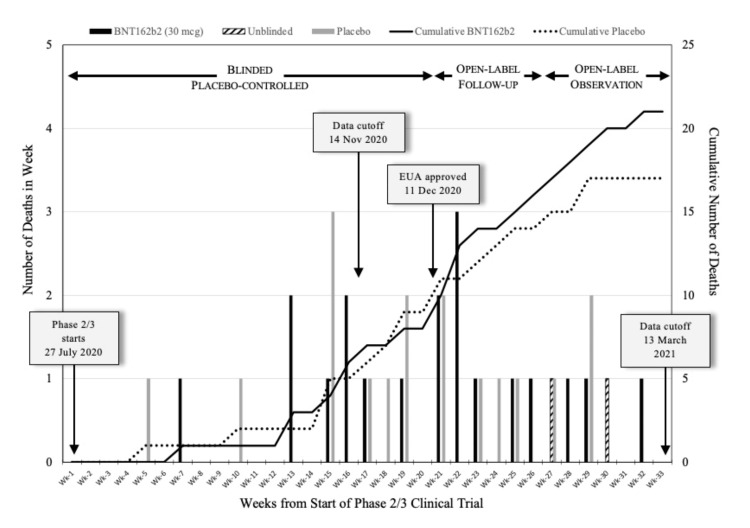
Figure 1. Analysis of Pfizer trial’s weekly mortality over a 33-week period.
This representation of the Pfizer trial by Michels et al. [54] showcases the weekly count of subject deaths from July 27, 2020, to March 13, 2021. Solid bars denote BNT162b2 recipients, gray bars signify the placebo group, and hatched bars represent previously unblinded placebo subjects who later received BNT162b2. The solid line represents the cumulative death count for the BNT162b2 group and the dotted line for the placebo group.
Image Source: Michels et al., 2023 [54]; Published with permission by authors under CC BY-NC-ND 4.0 Deed (Attribution-NonCommercial-NoDerivs 4.0 International)

