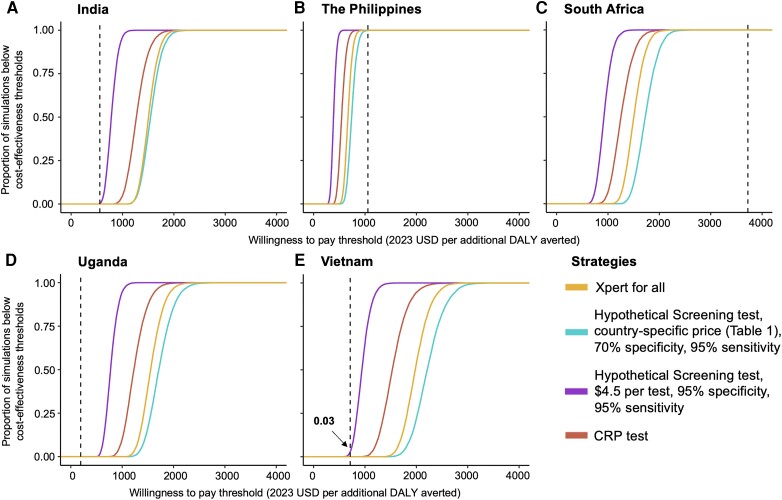
Figure 2.
Cost-effectiveness acceptability curves for community-based tuberculosis screening strategies in three countries. The y-axis of each graph shows the percentage of simulations falling below the willingness-to-pay threshold presented on the x-axis, for case-finding Scenario 2 (CRP test, red line), Scenario 3a (Hypothetical Screening test with country-specific costs, 95% sensitivity compared to Xpert Ultra positive TB, and 70% specificity; blue line), Scenario 3c (improved Hypothetical Screening test costing $4.5 per test, 95% sensitivity compared to Xpert Ultra positive TB, and 95% specificity; purple line) and Scenario 4 (Xpert for all; yellow line). As shown in Table 1, the prevalence of TB in India, Vietnam, and Uganda is lower than in South Africa or The Philippines. Corresponding country-specific willingness-to-pay thresholds [21] are represented as a vertical dotted red line in each graph. These thresholds correspond with economic development and are thus highest in South Africa, intermediate in The Philippines, and lowest in India, Uganda, and Vietnam. Labels denote the percentage of simulations falling below this willingness-to-pay threshold. Abbreviations: CRP, C-reactive protein; DALY, disability adjusted life year; TB, tuberculosis; USD, United States dollars.

