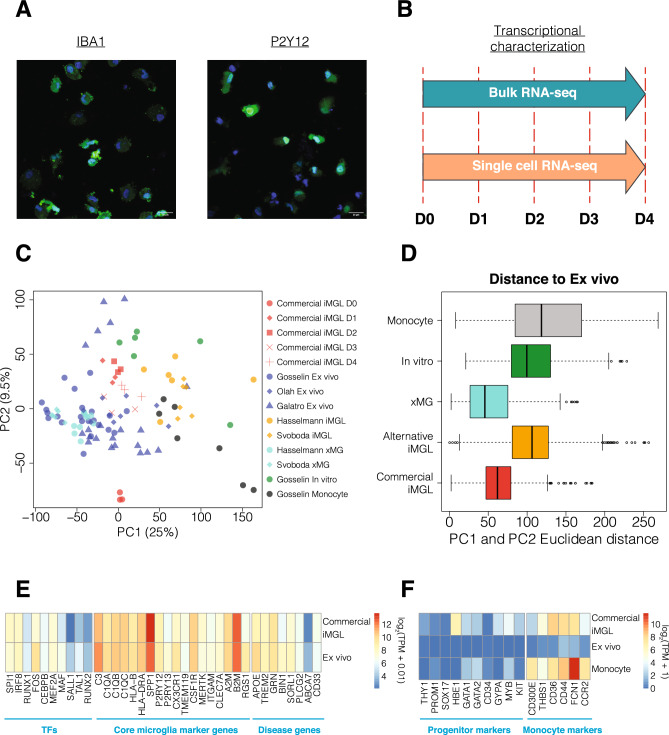
Figure 1.
Gene expression comparison between Commercial iMGL cells and microglia-related datasets. (A) Representative immunofluorescence images of Commercial iMGL cells stained with IBA1 or P2Y12 (green) and DAPI (blue). The scale bar represents 20 μm. (B) This study performed bulk and single cell transcriptional profiling of Commercial iMGL cells between 0 and 4 days in culture. (C) PCA clustering using top 2 PCs for Commercial iMGL cell samples and microglia comparator datasets. Variance explained by each principal component is shown in parenthesis. (D) Euclidean distances for all pairs of samples between ex vivo microglia and each of the other microglia groups. Euclidean distances were calculated using sample loadings on PC1 and PC2. (E) Comparison of gene expression levels for key microglia TFs, core marker genes, and disease risk genes between Commercial iMGL cells at Days 1–4 and ex vivo microglia. Expression levels displayed are the median values across samples. (F) Comparison of gene expression levels for HPC and EMP progenitor and monocyte markers between Commercial iMGL cells at Days 1–4, ex vivo microglia, and monocytes. Expression levels displayed are the median values across samples.

