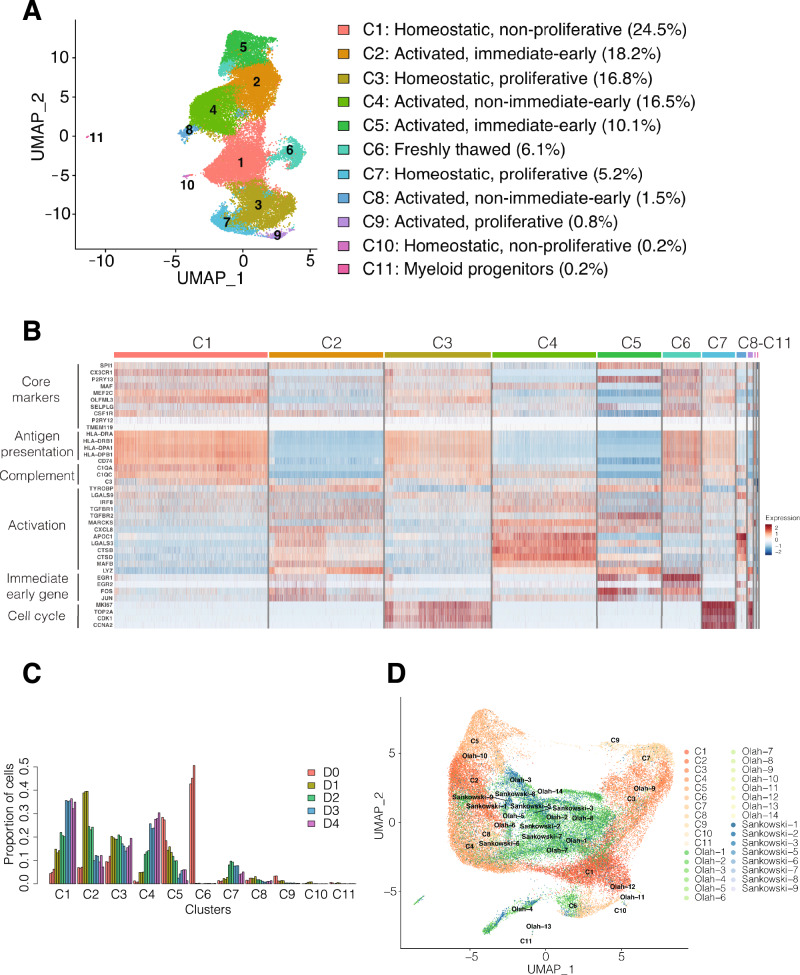
Figure 2.
Single cell RNA-seq profiling of Commercial iMGL cell cultures. (A) Identification of 11 cellular clusters in Commercial iMGL cell cultures. Functional annotations were assigned based on the expression of microglia functional marker genes as described in the “Methods” and shown in (B). (B) Gene expression heatmap of selected microglia functional marker genes in the time course single cell RNA-seq dataset. Heatmap with a more comprehensive list of marker genes is shown in Supplementary Fig. 6. (C) Proportion of cells in each cluster in the time course single cell RNA-seq dataset. (D) Integration of Commercial iMGL single cell RNA-seq dataset with two published ex vivo microglia single cell RNA-seq datasets (Olah and Sankowski).

