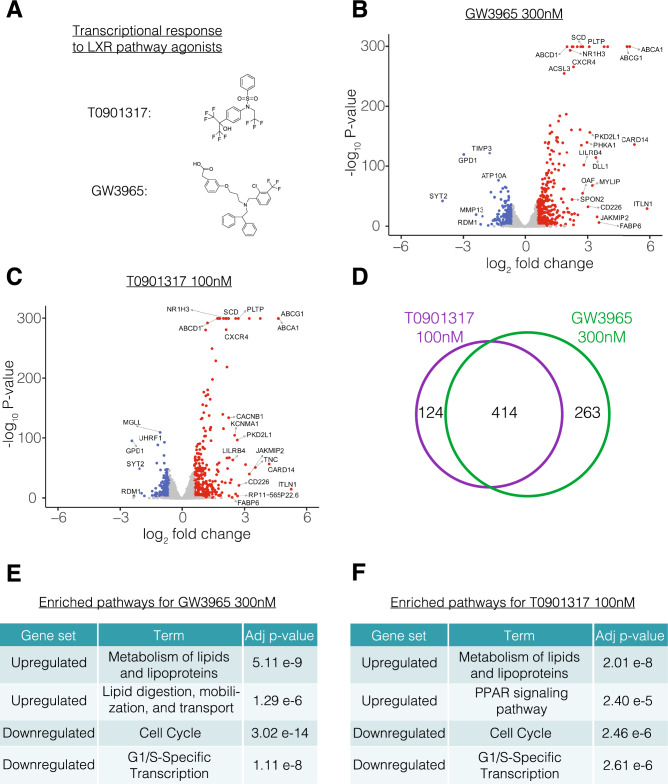
Figure 3.
Bulk transcriptional responses of Commercial iMGL cells to LXR agonist treatment. (A) Chemical structures of LXR pathway agonists GW3965 and T0901317. (B) Volcano plot showing relationship between expression fold change and significance for differential gene expression between GW3965 300 nM and DMSO treated cells. Genes with significant upregulation and downregulation in GW3965 300 nM are colored red and blue, respectively. (C) Volcano plot showing relationship between expression fold change and significance for differential gene expression between T0901317 100 nM and DMSO treated cells. Genes with significant upregulation and downregulation in T0901317 100 nM are colored red and blue, respectively. (D) Overlap in DEGs between GW3965 300 nM and T0901317 100 nM treatments. (E) Selected pathway enrichments for DEGs with GW3965 300 nM treatment. (F) Selected pathway enrichments for DEGs with T0901317 100 nM treatment.

