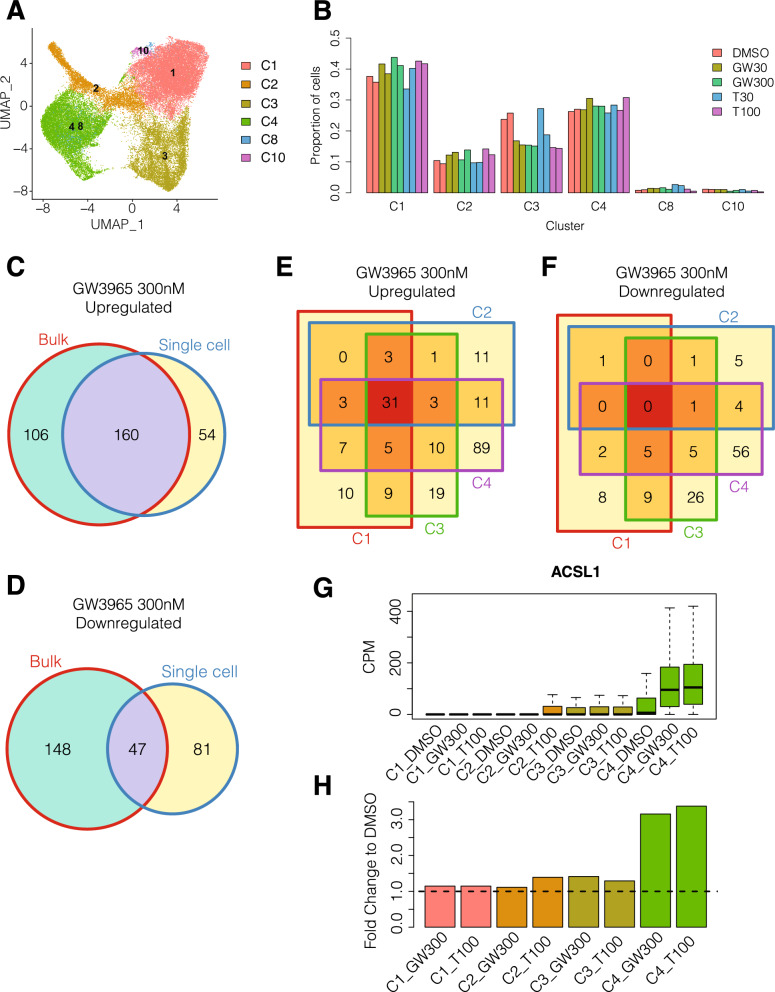
Figure 4.
Single cell transcriptional responses of Commercial iMGL cells to LXR agonist treatment. (A) Identification of 6 single cell clusters in LXR agonist treated Commercial iMGL cells. Cluster names were matched to the time course single cell RNA-seq dataset (Fig. 2A) using microglia functional marker genes (Supplementary Fig. 17) as described in the “Methods”. (B) Proportion of cells belonging to each single cell cluster in the LXR agonist treatment single cell RNA-seq dataset. Treatments are abbreviated: DMSO, GW3965 30 nM (GW30), GW3965 300 nM (GW300), T0901317 30 nM (T30), and T0901317 100 nM (T100). (C) Overlap in upregulated DEGs between bulk RNA-seq and the union of single cell RNA-seq DEGs in clusters C1, C2, C3, C4, C8, and C10 with GW3965 300 nM treatment. Bulk DEGs were filtered to genes tested in at least one single cell contrast. (D) Overlap in downregulated DEGs between bulk RNA-seq and the union of single cell RNA-seq DEGs in clusters C1, C2, C3, C4, C8, and C10 with GW3965 300 nM treatment. Bulk DEGs were filtered to genes tested in at least one single cell contrast. (E) Overlap in upregulated DEGs for single cell clusters C1, C2, C3, and C4 with GW3965 300 nM treatment. (F) Overlap in downregulated DEGs for single cell clusters C1, C2, C3, and C4 with GW3965 300 nM treatment. (G) Expression of ACSL1 gene in single cells assigned to clusters C1, C2, C3, and C4 from DMSO, GW3965 300 nM (GW300), and T0901317 100 nM (T100) treatments. (H) Fold change of ACSL1 gene compared to DMSO in single cells assigned to clusters C1, C2, C3, and C4 from GW3965 300 nM (GW300) and T0901317 100 nM (T100) treatments.

