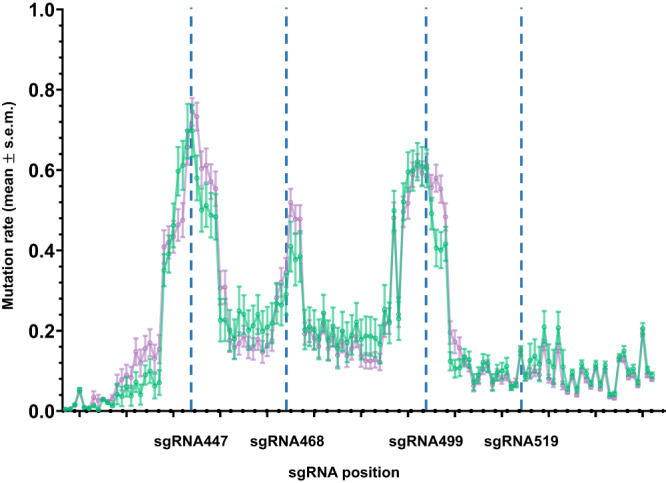
Fig. 3. Mutational rates vary for kmo targets sgRNA447, sgRNA468, sgRNA499, and sgRNA519.

Dashed blue lines represent the expected cut sites of corresponding sgRNAs. Green line represents white-eyed F2 larvae which did not inherit the kmosgRNAs transgene (non-transgenic or inheriting only the bgcn-Cas9 element) from the ♂ kmosgRNAs; bgcn-Cas9 x ♀ kmo−/− cross. Purple line represents reciprocal cross: white-eyed F2 larvae which did not inherit the kmosgRNAs transgene from the ♂ kmo−/− x ♀ kmosgRNAs; bgcn-Cas9 cross. Data points are the mean proportion of mutant nucleotides at each position of the kmo region targeted as determined by CRISPResso2, error bars are the s.e.m. (standard error of the mean). Source data are provided as a Source Data file.
