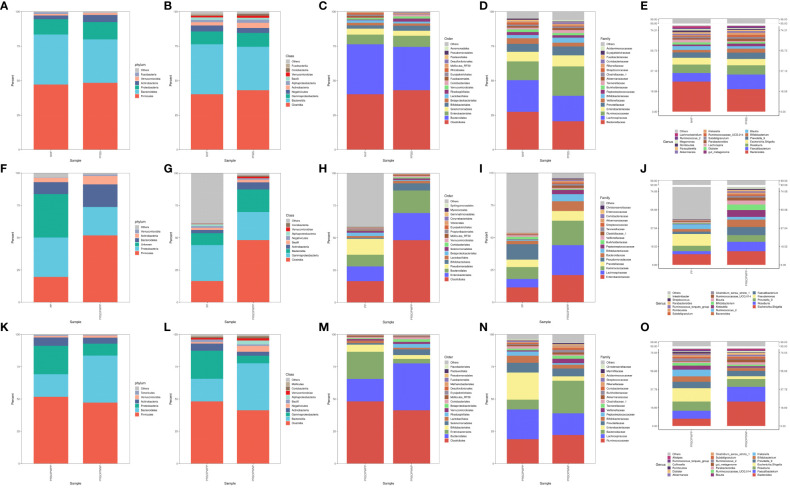
Figure 1.
Bar charts of species composition at the phylum, class, order, family, and genus levels. (A-E) Composition and abundance of the core microbiota in the NHF and PFBS groups. (F-J) Composition and abundance of the core microbiota in the PP and PRSOPWPP groups. (K-O) Composition and abundance of the core microbiota in the PRSOPWPP and PRSOPWNP groups.

