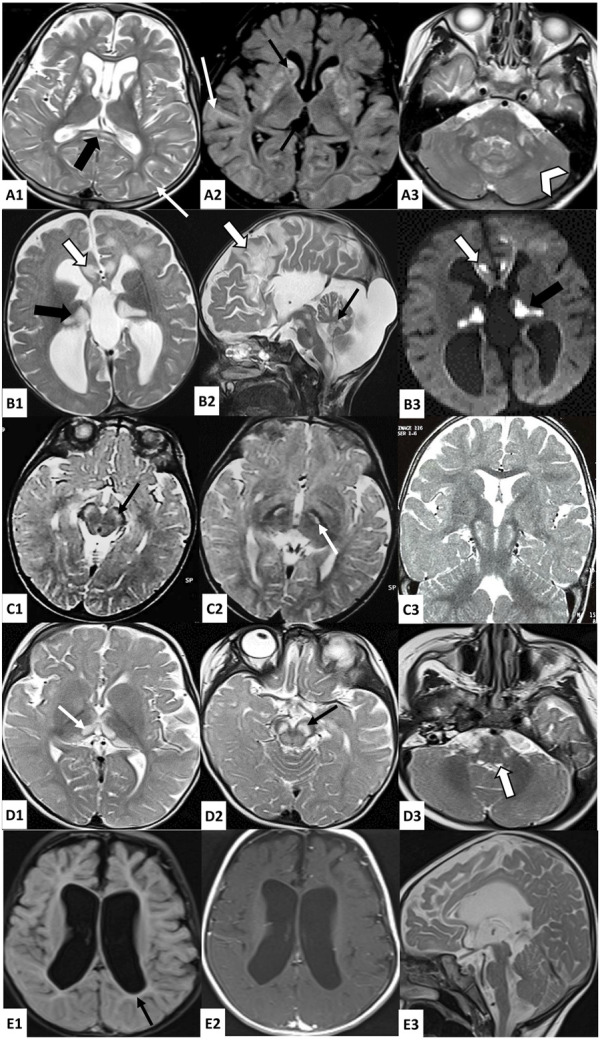
FIGURE 1.

Brain MRI findings in investigated patients. A: Axial T2 (A1, A3) and FLAIR (A2)-weighted images of patient 1 brain MRI showing bilateral and symmetrical striatal hyperintensities, with the presence of cavitations (thin black arrow), associated with T2 and FLAIR hyperintensities of the periventricular and subcortical white matter (thin white arrow), splenium of the corpus callosum (thick black arrow), middle cerebellar peduncles (thick white arrow), and cerebellar white matter (white arrowhead); B: Axial (B1-B3) and sagittal (B2) brain MRI of patient 2 showing bilateral hyperintense lesions in T2 (B1, B2) and diffusion (B3)-weighted images affecting the cortex and subcortical white matter in frontal areas (thick white arrow), the thalami (thick black arrow), the midbrain, the pons, the medulla oblongata, and the cerebellum (thin black arrow), as well as cortico-subcortical atrophy predominant at the subtentorial level and agenesis of the corpus callosum; C: Axial (C1, C2) and coronal (C3) T2-weighted images of patient 3 brain MRI showing bilateral and symmetrical hyperintensities affecting the cerebral peduncles (thin black arrow) and subthalamic nuclei (thin white arrow); D: Axial (D1–D3) T2-weighted images of Patient 4 brain MRI showing bilateral and symmetrical hyperintensities affecting the thalami (thin white arrow), the midbrain (thin black arrow) and the posterior part of the medulla oblongata (thick white arrow); E: Axial (E1, E2) and sagittal (E3) brain MRI of patient 5 showing significant subcortical atrophy with the enlargement of the third and lateral ventricles, mild hyperintensities of the periventricular white matter in FLAIR-weighted image (E1) which are isosignal in T1-weighted image (E2), and hypoplasia of the brainstem.
