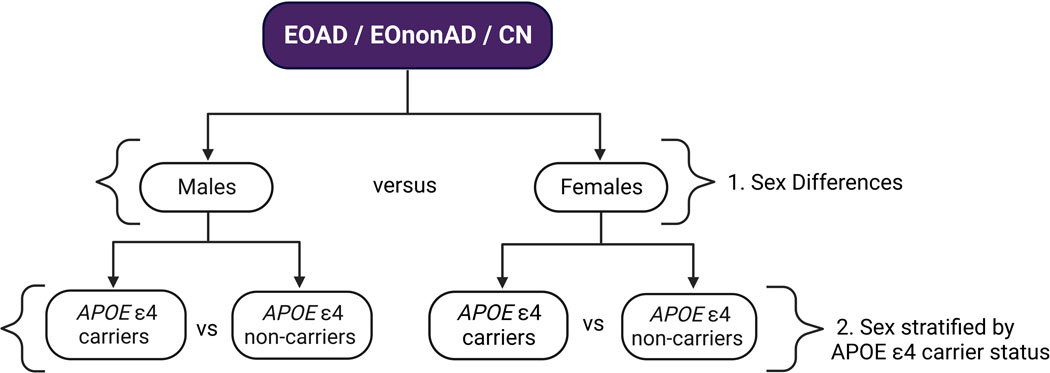
Figure 1. Analysis Workflow.
A visual representation of the groups used for each analysis. 1) Males were compared to females in each diagnostic group for demographic, imaging biomarker and 3D analyses. 2) Male APOE-ε4 carriers were compared to male ε4 non-carriers and female APOE-ε4 carriers were compared to female ε4 non-carriers in each diagnostic group for demographic, imaging biomarker and 3D analyses.

