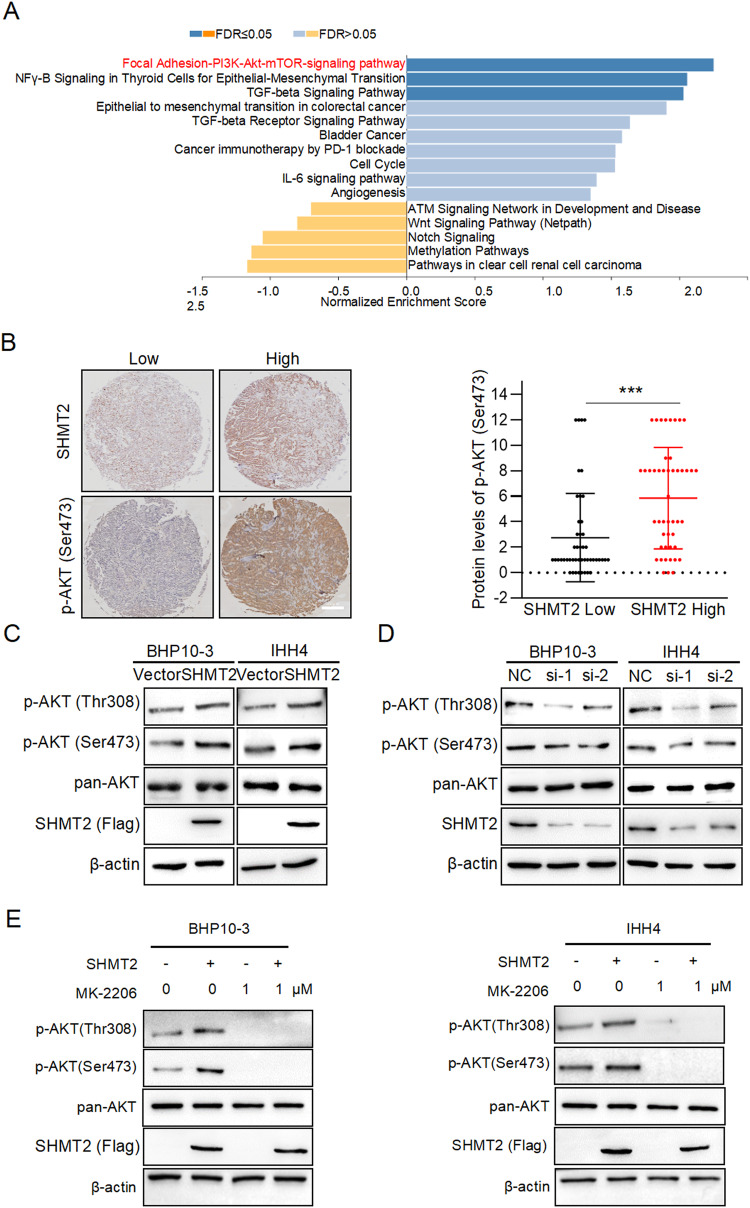
Fig. 3. SHMT2 activates AKT signaling pathway.
A GSEA analysis was performed with the differentially expressed proteins from tumor and para-tumor tissues. B Protein levels of p-AKT (Ser473) and SHMT2 were detected by IHC staining in tumor tissues. Left panel: representative histological micrographs of IHC. Scale bar, 200 μm. Right panel: statistical analysis of the correlation of p-AKT (Ser 473) and SHMT2 in tumor tissues. n = 58. ***: p < 0.001. C, D Levels of p-AKT (Ser473 and Thr308) were detected in BHP10-3 or IHH4 cells with SHMT2 overexpression or knockdown by using western blot, respectively. E BHP10-3 and IHH4 cells were transfected with SHMT2 and/or treated with MK-2206, individually or simultaneously. Then phosphorylation of AKT was determined in these cells.

