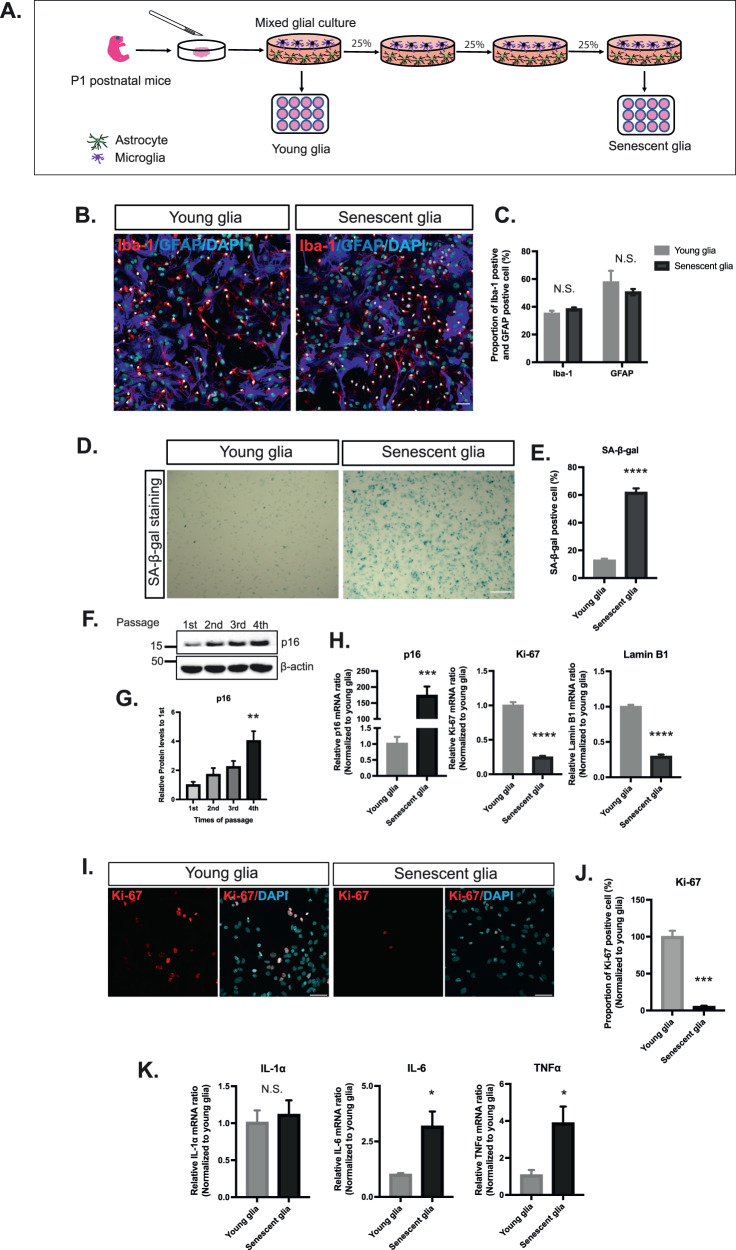
Fig. 2. The establishment of replicative senescent glia.
A Glia, obtained from P1 postnatal mice cortex, was seeded with a 1 × 10⁵ cells/cm2 density and grown until 100% confluence. For each passage, only 25% of the total cells were seeded. Passages were repeated thrice. Cells, considered to be young cells, were the cells before the first passage. In contrast, senescent cells were identified as those that finished three passages (completing the population doubling six times). B Representative images of the C proportions of the Iba-1-positive cell (microglia) and GFAP-positive cell (astrocyte) in young and senescent glia (n = 3) (scale bar: 50 μm). D SA-β-gal staining images of young and senescent glia (scale bar: 200 μm). E Quantification and statistical results of the SA-β-gal expression level (n = 8). F Representative western blotting image showing expression levels of p16 at each passage. G Quantification and statistical results of p16 expression level at each passage. H Real-time PCR result of three main cellular senescence markers (p16, Ki-67, lamin B1) for young and senescent glia (n = 6). I Representative Ki-67 immunofluorescence staining images (scale bar: 20 μm). J Statistical results of the proportion of Ki-67-positive cells in young and senescent glia (n = 6). K Real-time PCR results of SASPs (IL-1α, IL-6, TNF-α) (n = 6). Values are presented as means ± SEMs, and statistical significance was determined using the unpaired t-test (C, H, J, K), two-way ANOVA with Bonferroni test (E), and ordinary one-way ANOVA (G). *p < 0.05, **p < 0.01, ***p < 0.001, ****p < 0.0001.

