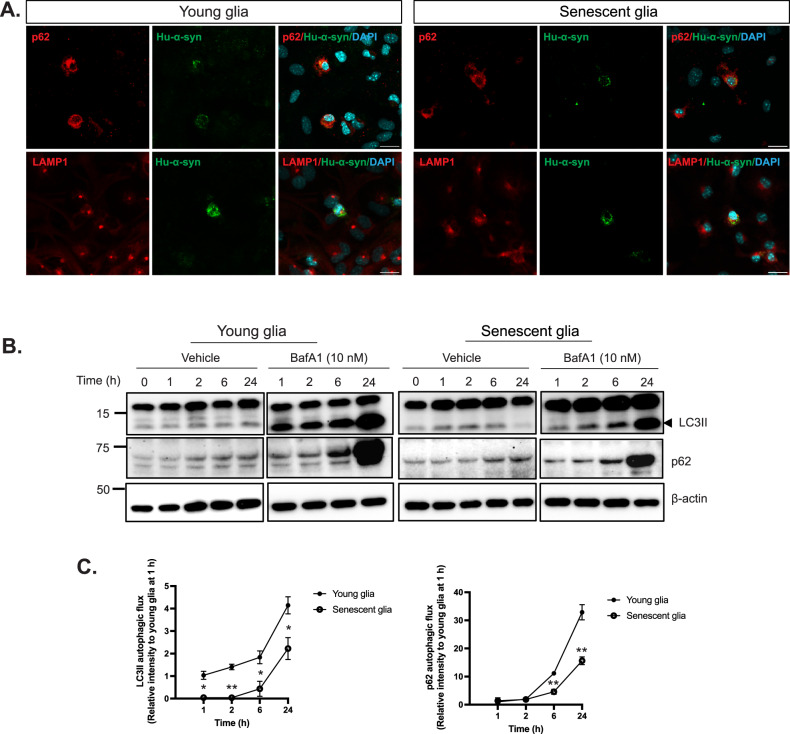
Fig. 5. The autophagic flux of young and senescent glia after hu-α-syn PFF treatment.
A Representative image of colocalization of hu-α-syn inclusion with p62 and LAMP1 in young and senescent glia 6 h after washing out (scale bar: 20 μm). B Representative western blotting of LC3B and p62 1 h after treatment of hu-α-syn PFF. The glia was incubated with or without BafA1 (10 nM) C Quantification and statistical results of LC3II and p62 autophagic flux (the difference of LC3II and p62 under BafA1 and no-BafA1 condition) (n = 3). Values are presented as means ± SEMs and statistical significance was determined by two-way ANOVA with the Bonferroni test. *p < 0.05, **p < 0.01.

