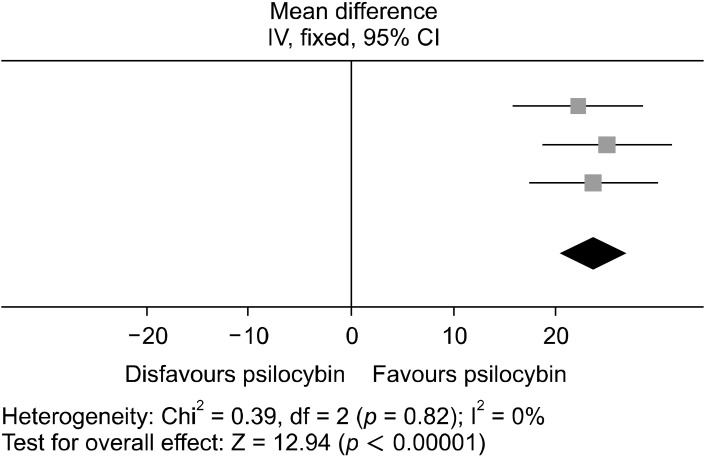
Fig. 6.
Forest plot conducted using RevMan, showing the MD between baseline and up to 6 weeks post intervention BDI scores. Each study significantly favors psilocybin for reducing depressive symptoms. The squares represent the individual studies with the size representative of the weight of the study in the analysis. The diamond represents the overall/summary effect, and the lines represent the confidence intervals.
MD, mean difference; CI, confidence interval; BDI, Beck Depression Inventory.

