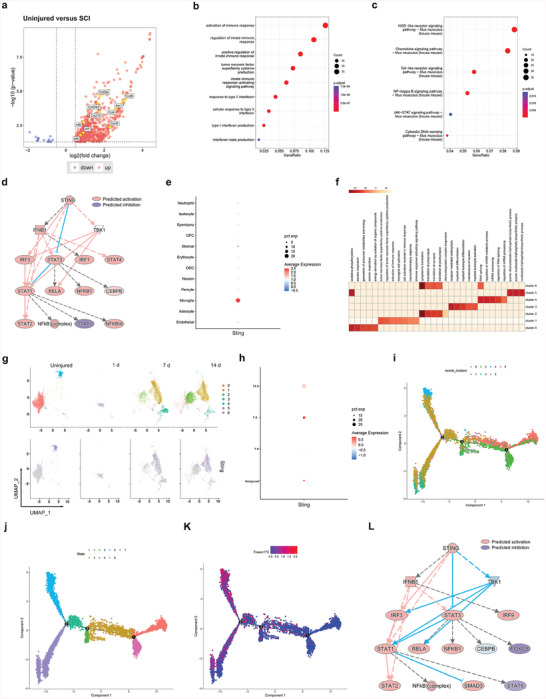
Figure 1.

The cGas‐Sting pathway is activated in SCI mice. a) Volcano plot of RNA‐seq data from spine tissue from 8‐week‐old C57BL/6 uninjured and SCI mice. Red and blue dots represent genes with a log2 FC (fold change) of >0.5 and < −0.5, respectively. All other genes are colored gray. Selected genes such as Irf, Cxcl, and Ccl are labeled. b) The GO enrichment analysis revealed hallmark pathways associated with the DEGs, which are upregulated in the control samples compared to the SCI samples. c) KEGG enrichment analysis revealed hallmark pathways associated with the DEGs, which are upregulated in control samples compared to SCI samples. d) IPA prediction of Sting (Sting1, Tmem173) as an upstream regulator of upregulated DEGs identified using an activation z score of >1 and a p‐value overlap of <0.05. e) Dot plot of normalized cell‐type expression of Sting (Sting1, Tmem173) in snRNA‐seq samples (n = 1); OPCs, oligodendrocyte progenitor cells; ODC, oligodendrocytes. f) The GO enrichment analysis revealed hallmark pathways associated with spinal cord microglia clusters (subtypes). g) UMAP plots showing temporal changes of spinal cord microglia clusters (subtypes) and indicating temporal changes of Sting in microglia. h) Dot plot indicating temporal expression changes of Sting (Sting1, Tmem173) in spinal cord microglia clusters (subtypes). i,k) Single‐cell trajectory and pseudo‐time analysis of microglia clusters defined the proliferation advantage cluster and the metabolism advantage one. l) IPA prediction of Sting (Sting1, Tmem173) as an upstream regulator of upregulated DEGs identified using an activation z score of >1 and a p‐value overlap of < 0.05.
