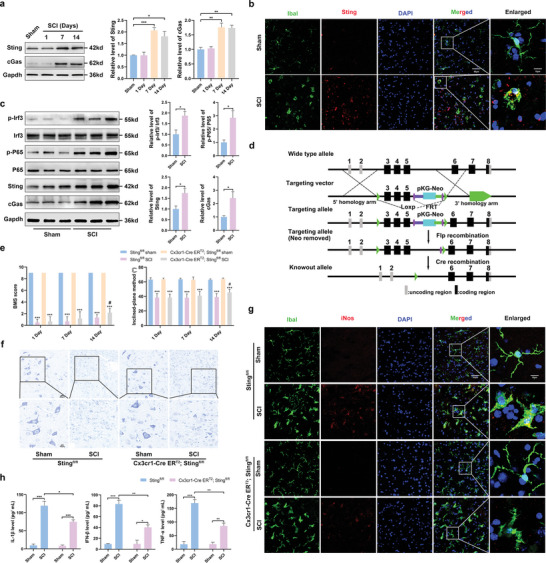
Figure 2.

Activation of cGas‐Sting signal played a key role in the secondary SCI. a) Western blots analysis of cGas and Sting levels in the perilesional tissues at 1, 7, and 14 d after SCI. b) Sting /Iba1 double immunostaining in the perilesional tissues 7 d after SCI (Scale bar: 50 µm). c) Western blot analysis of cGas, Sting, Irf3, p‐Irf3, P65, and p‐P65 protein expression in the perilesional tissues 7 d after SCI. d) Diagram for construction of microglia‐specific Sting knockout mice. e) Effects of Sting knockout on neurological function scores at 1 d, 7 d, and 14 d after SCI. f) Representative confocal images of M1 state (iNOS+/Iba1+) were obtained from the perilesional tissues 7 d after SCI. g) Nissl staining in the perilesional tissues 7 d after SCI (Scale bar = 20 µm). h) Levels of pro‐inflammatory cytokines, including IL‐1β, IFN‐β, and TNF‐α in the perilesional tissues 7 d after SCI. n = 6 for each group. Error bars denote mean ± SEM, ns, no significance, *** p < 0.001 versus sham group in each strain of mice, # p < 0.05 versus Cx3cr1‐Cre ERT2; Stingfl/fl group.
