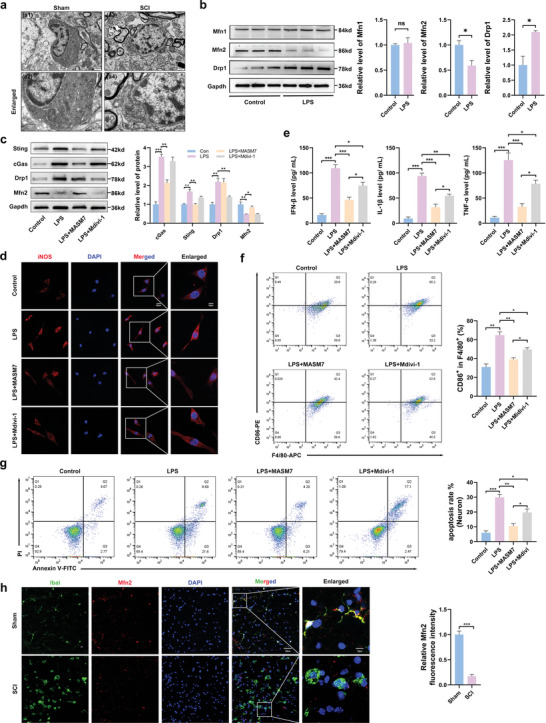
Figure 5.

Mitochondria swelling and expression of mitofusin decreased after SCI. a) Representative ultrastructure of microglia in the perilesional tissues at 7 d after SCI (Scale bar: 1 µm (a1,a2) and 0.5 µm (a3,a4)). b) Western blot analysis of the Drp1, Mfn1, and Mfn2 levels in microglia of Control and LPS. c) Western blot analysis of cGas, Sting, Drp1, and Mfn2 levels in microglia of Control and LPS, LPS+MASM7, and LPS+Mdivi‐1. d) Representative of immunofluorescence staining of M1 state (iNOS) in microglia (Scale bar: 20 µm). e) Levels of pro‐inflammatory cytokines, including IL‐1β, IFN‐β, and TNF‐α in the medium of microglia. f) Flow cytometric analysis on the expression levels of M1 ratio (F4/80/ CD86+). g) The neuron death rate measured by Annexin V and PI staining. n = 6 for each group. h) Mfn2 /Iba1 double immunostaining in the perilesional tissues 7 d after SCI (Scale bar: 50 µm). Error bars denote mean ± SEM, ns, no significance, * p < 0.05, ** p < 0.01, and *** p < 0.001.
