Figure 6.

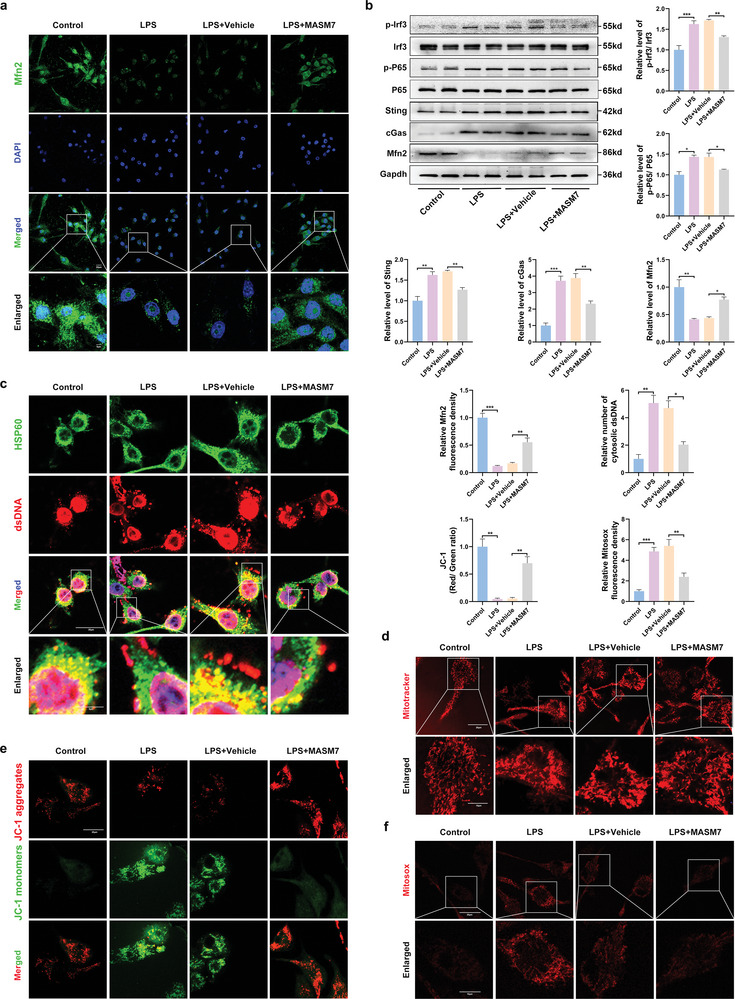
Mitochondrial fission‐induced mtDNA release mediates activation of Sting signaling in LPS‐induced microglial. a) Representative of immunofluorescence staining of Mfn2 in microglia in different groups (Scale bar = 20 µm). b) Western blot and quantitative analysis of Mfn2, cGas, Sting, Irf3, p‐Irf3, P65 and p‐P65 in microglia of Control, LPS, LPS + vehicle, and LPS + MASM7. c) dsDNA and HSP60 double immunostaining microglia in different groups (Scale bar: 20 µm). d) Representative MitoTracker fluorescence images illustrating mitochondrial morphology in microglia (Scale bar: 20 µm). e) Representative fluorescence staining of JC‐1 aggregates (red)/JC‐1 monomers (green) illustrating the MMP (Scale bar: 20 µm). f) Representative MitoSOX fluorescence images of mitochondria‐derived ROS (Scale bar: 20 µm). Error bars denote mean ± SEM, ns, no significance, * p < 0.05, ** p < 0.01, and *** p < 0.001.
