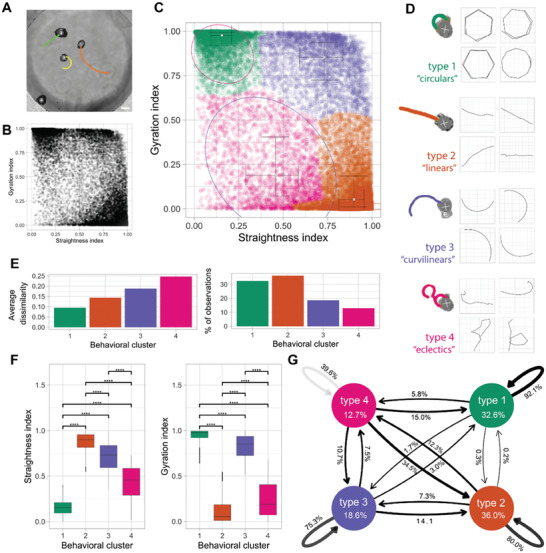
Figure 2.

Anthrobots self‐organize into discrete movement types. A) Anthrobots display different movement types. Scalebar 100 uM. B) Distribution of all 30‐second periods in the analysis plotted by their straightness and gyration indices, showing signs of clustering near three of the 4 corners of the plot. C) Clustered scatter plot of all 30 s periods with centers of cluster marked and colored. D) Prototypical examples from each cluster with 30 s sample trajectories. E) Quantitative comparison of key characteristics of the four clusters in terms of intra‐cluster homogeneity “average dissimilarity”) and occurrence frequency (“% of observations”) which show that the largest clusters 1 and 2 have relatively low dissimilarity indicating these are the most consistent behavioral patterns. F) Comparison of gyration and straightness indices for each cluster with significance levels indicated, showing that each cluster occupies a unique, quantifiable position in the sample space. P‐value range after pairwise 2‐sample t‐test of 0 to 0.0001 corresponded to ****, 0.0001 to 0.001 corresponded to ***, 0.001 to 0.01 corresponded to **, 0.01 to 0.05 corresponded to * and 0.05 to 1 corresponded to ns. Cluster one had 6004 30 s periods, cluster two had 6700, cluster three had 3436 and cluster 4 had 2384. G) Markov chain showing state transitions between different clusters (same as in Figure 2F) and the degree of commitment to a given behavior (persistence), with the circular bots (type 1) as the most committed category with 92.1% chance of the next period being a circular if the current period is a circular. It is followed by linear and curvilinear, which are also relatively consistent at 80.0% and 75.3% respectively. Cluster 4, or the eclectics, as expected, are very unstable, with a consistency of only 39.6%. Cluster 4 seems to act as a sort of intermediate, since there is a substantial chance of the eclectics converting to linear (34.5%) or to a lesser degree circular (15.0%) or curvilinear (10.7%). The transition probability between circulars and linear and vice versa is the lowest and almost nonexistent, at 0.3% and 0.2% respectively. Linear, curvilinear, and circulars rarely convert into eclectics with a probability of 12.3%, 7.5%, 5.8% respectively (and when they do, it is most likely due to collisions or using eclectics as an intermediary).
