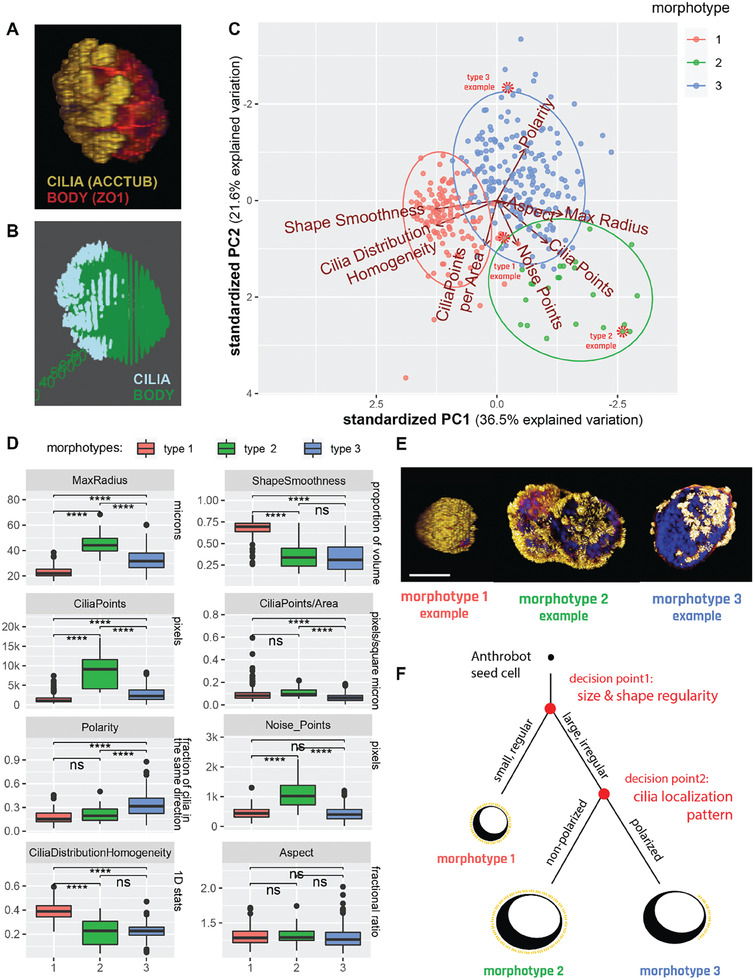
Figure 3.

Anthrobots self‐organize into distinct morphological types. A) Anthrobot immunocytochemistry enables morphological classification pipeline. Sample immunological stain for cilia (acctub, i.e., acetylated α‐tubulin) and apical layer marked by the tight junction marker (ZO1) acquired as a complete 3D Z‐stack showing the Anthrobot body boundaries and cilia localization on the body. B) Binarized version of the sample immunological data, used as input to the morphological characterization pipeline. C) Binarized body and cilia information from 350 Anthrobots plotted along 8 morphological indices on an 8D cloud and clustered with the unsupervised Ward.D2 method, which identify global clusters based on the proximity of the centroids of locally emerging clusters and merging them together when applicable. PCA showing the three morphotypical clusters on the highest variation plane, marked by PC1 and PC2. Red dashed circles point to specific examples featured in panel E, selected from the cluster edges for distinct representation. D) Distinct morphotypes translate with significance to differences in real‐life morphological metrics, characterized by 8 variables from which the PCA was computed. P‐value range of 0 to 0.0001 corresponded to ****, 0.0001 to 0.001 corresponded to ***, 0.001 to 0.01 corresponded to **, 0.01 to 0.05 corresponded to * and 0.05 to 1 corresponded to ns. Cluster 1,2 and 3 in the analysis corresponded to the clusters in the PCA, with n = 125, 24 and 201 respectively. We ran a two‐sided, two‐sample t‐test on all pairs of clusters, for all 8 variables, which are then plotted here. E) Sample morphotype examples for Type 1, 2 and 3 chosen for their ability to best represent the cluster. Type 1 Anthrobots are small, regularly shaped, tightly and uniformly covered by cilia. Type 2 and 3 bots are larger, more irregularly shaped and have less tightly‐knit cilia patterns, with type 3 bots featuring significantly more polarized cilia coverage. Scalebar 50 uM. F) Decision tree of Anthrobot morphogenesis with two major checkpoints as revealed by the PCA hierarchy: first decision point is size/shape (has equal impact), second decision point is cilia localization pattern.
