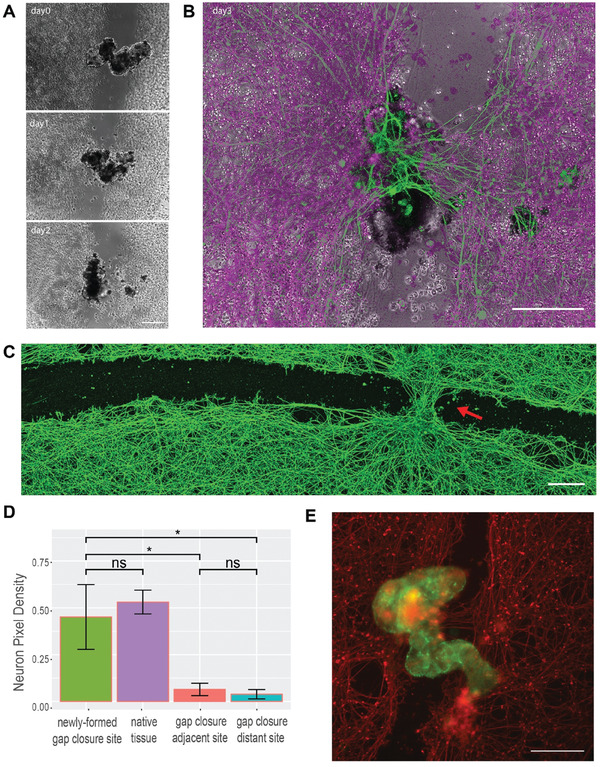
Figure 6.

Anthrobots can promote gap closures on scratched live neuronal monolayers. A) sample micrograph of a bridge across a neural scratch over time from bridge inoculation day (day0) to days 1 and 2. B) An overlay of a bridge bot and the induced “stitch” (i.e., gap closure site) at the end of the observation on day 3. C) Immunological staining of neurons with Beta III Tubulin (Tuj1) upon fixation on day 3 after the bots were introduced to the system, showing an induced neural gap closure at the site of bot settlement. D) Among N = 10 experimental replicates, 50% of the Anthrobot bridges have maintained connectivity to both sides of the scratch area across all three days of the experiment (i.e., fully connected bridges), and among these bridges, 100% has yielded gap closure underneath at the neuronal scratch site. Shown here is a quantification of the resulting tissue on day 3 of all fully connected bridges measured by average proportion of neuronal coverage by pixel counts for each positional category: gap closure site, unscratched native tissue (calculated by the average of the two neuron‐heavy area pixel coverage), adjacent and distant sites to the gap closure. Difference between gap closure site and native tissue is insignificant (p = 0.37), while the difference between the gap closure site and both adjacent and distal scratch sites are significant (w/ p = 0.006 and p = 0.005, respectively); that suggests the tissue at the gap closure site is as dense as the native tissue, and the gap closure effect follows a crisp profile as opposed to a gradient profile. P‐value range of 0 to 0.0001 corresponded to ****, 0.0001 to 0.001 corresponded to ***, 0.001 to 0.01 corresponded to **, 0.01 to 0.05 corresponded to * and 0.05 to 1 corresponded to ns. See methods section for example frame of a sampling region. Scratch lengths varied between 150–500 um E) Immunological staining of another sample bridge superbot (green) and the neuronal tissue (red). All scalebars on this figure feature 200 microns.
