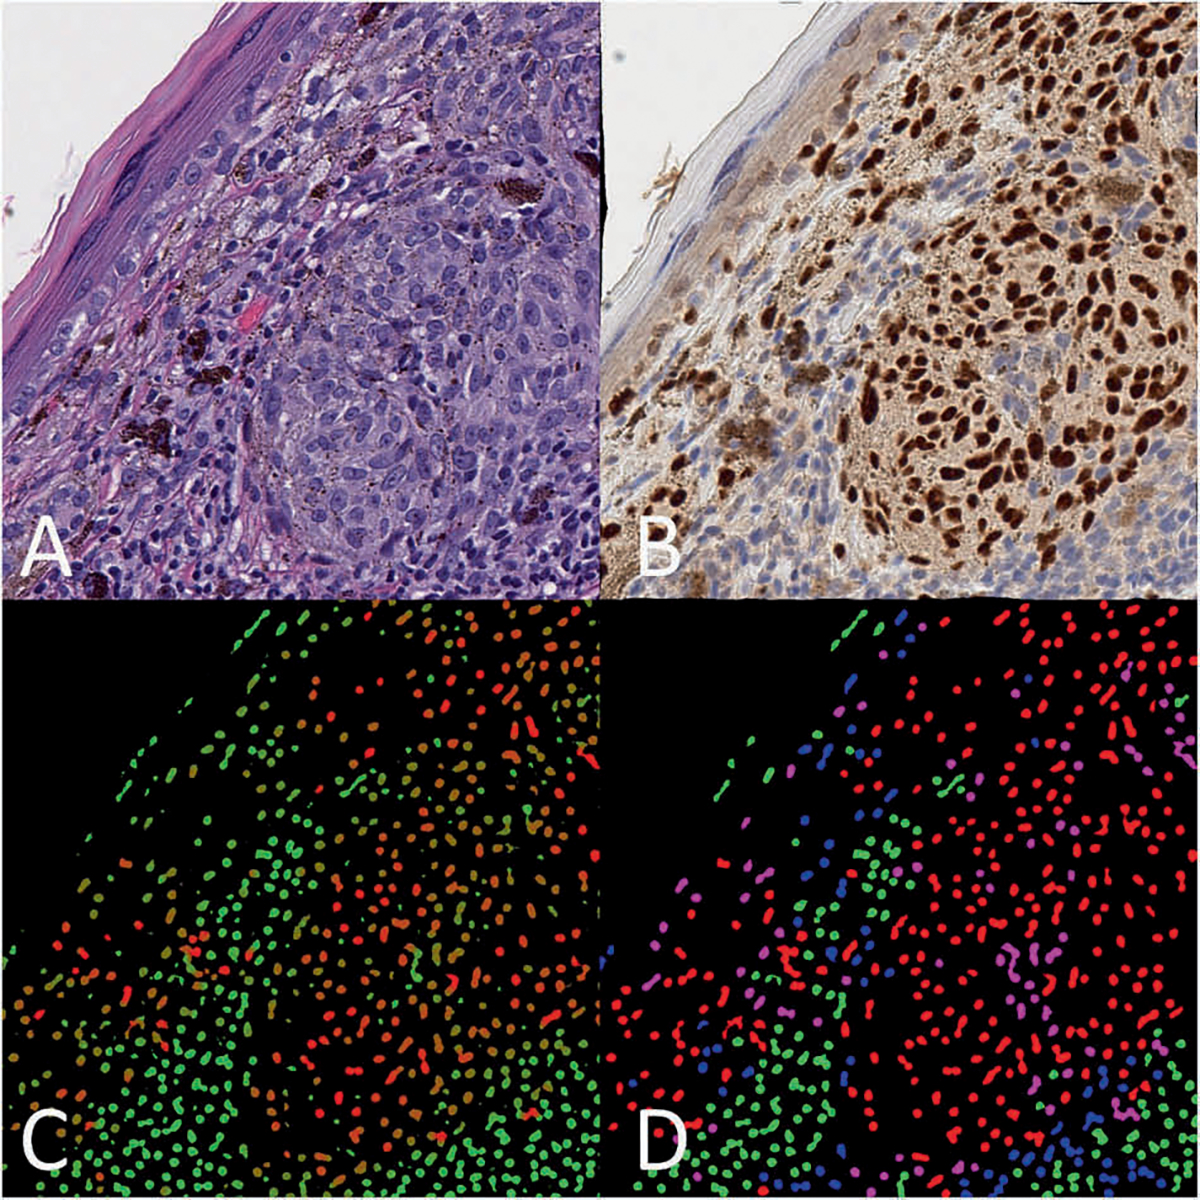
Fig. 3. Example image from NN-test set.

a H&E image of melanoma in a tissue section of skin (H&E, 400×); b corresponding IHC (SOX10, 400×); c raw vIHC output, where the green color channel is scaled to the SOX10-negativity score, and the red color channel is scaled to the SOX10-positivity score. A strongly red nucleus is predicted to be SOX10 positive, while a strongly green nucleus is predicted to be SOX10 negative. d Corresponding color map where nuclei are colored depending on their true SOX10 IHC and predicted vIHC positivity. True positives are colored red, true negatives are colored green, false positives are colored pink, and false negatives are colored blue.
