Figure 1.
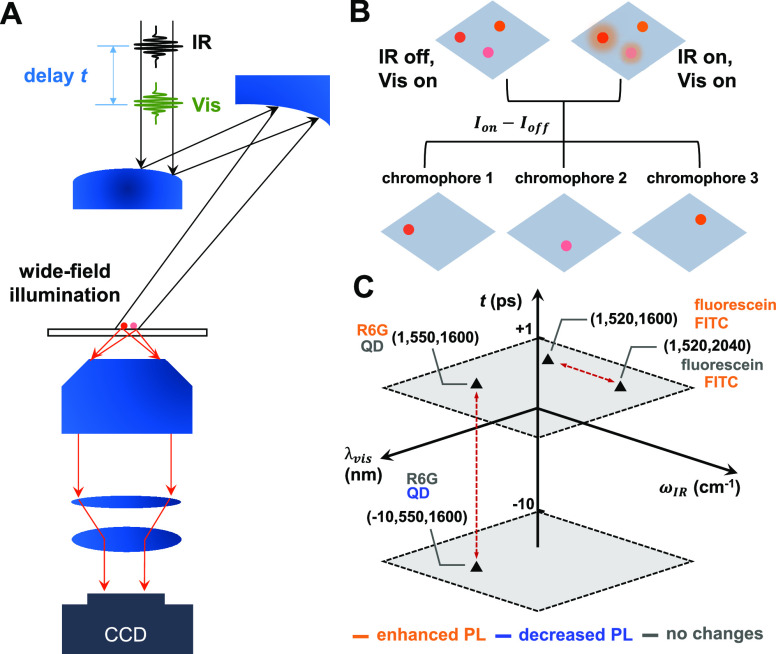
Principles of MD-WISE microscopy. (A) Schematic illustration for MD-WISE microscopy, positive delay of t denotes that the IR pulse arrives earlier than the visible pulse. (B) Intensity of PL signals generated following the visible excitation pulse can be encoded by the optical frequency of the IR pulse or the delay t. By taking the difference of PL intensities between images acquired with (Ion) or without the IR pulse (Ioff), various chromophores can be distinguished apart even if their emission spectra are nearly identical. (C) Change of a chromophore’s PL induced by the IR pulse, either there is no change (gray), or increased PL (orange) or decreased PL (blue), is a function of independently tunable variables expressed as the three orthogonal axes: visible excitation wavelength λvis (nm), IR frequency ωIR (cm–1), and ultrafast delay t (ps). By choosing a condition (▲) in the three-dimensional space, pairs of chromophores with nearly identical PL spectra can be distinguished from each other, such as the pairs of QD versus R6G and FITC versus fluorescein. The two gray shaded planes are condition planes having the same delay, +1 or −10 ps, and the coordinates in brackets are expressed as (t, λvis, ωIR).

