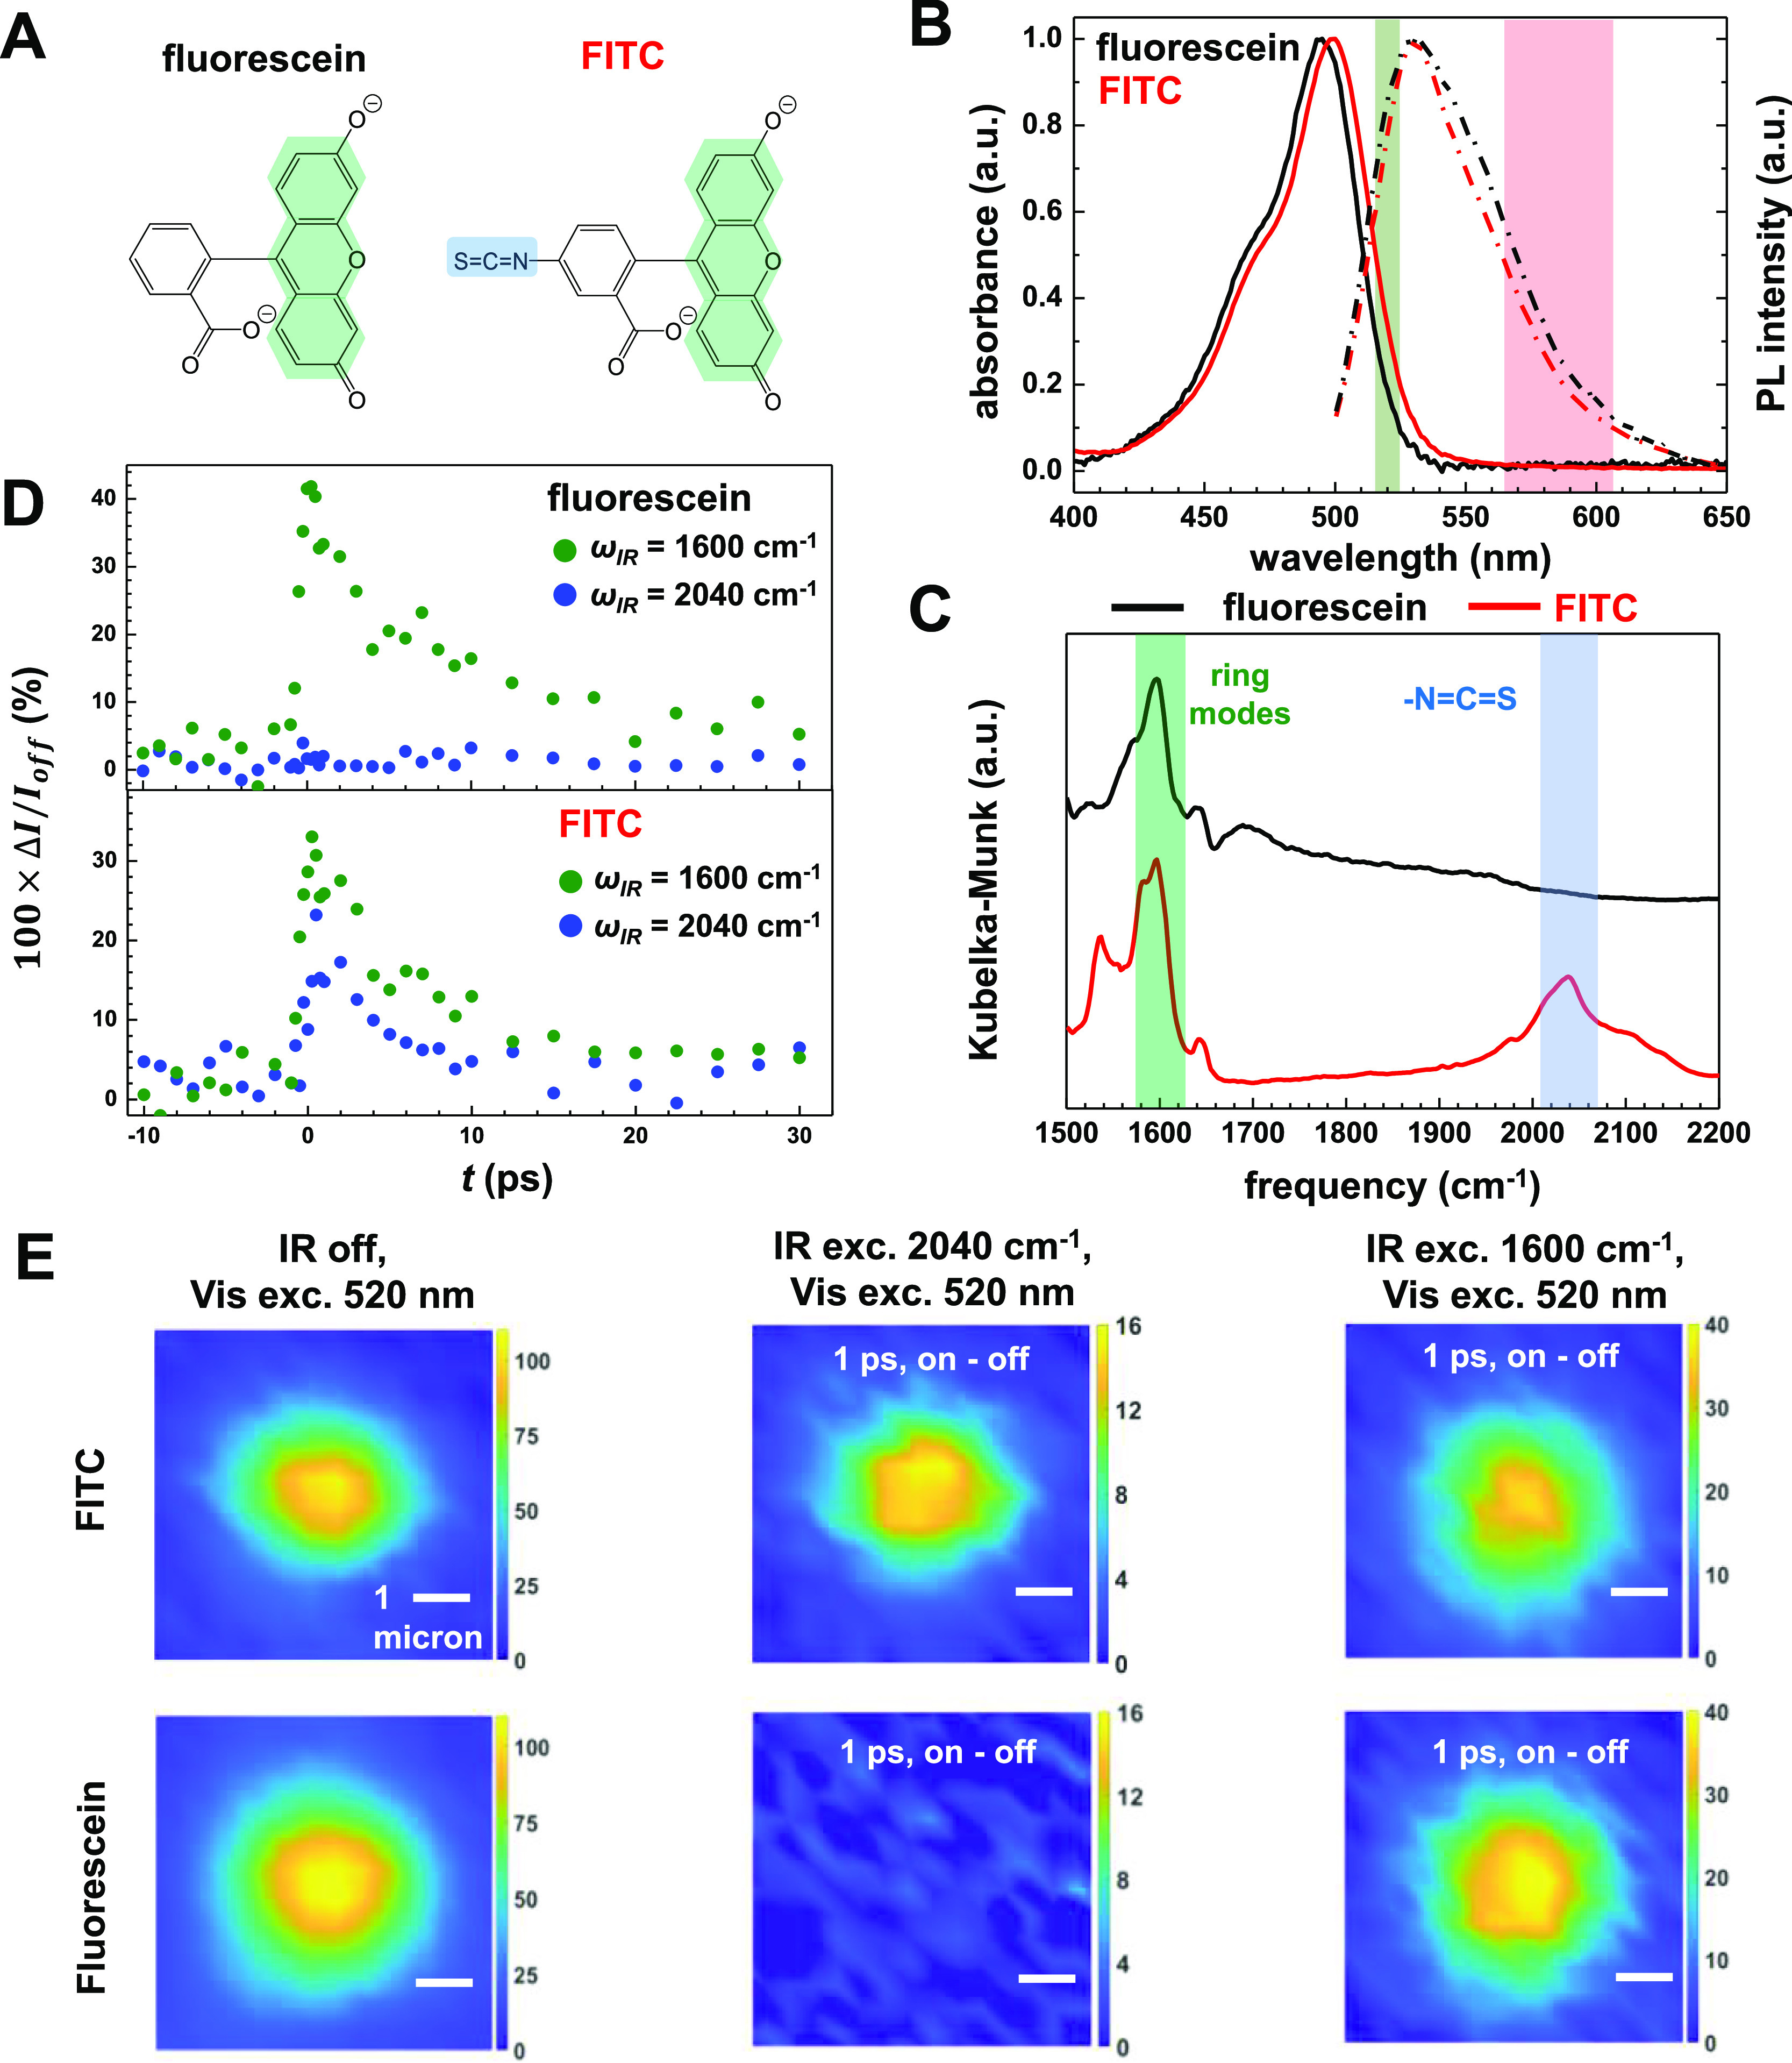
Figure 4.

Distinguishing molecular dyes by tuning the IR frequency. (A) Molecular structures of fluorescein and FITC anions. The green shade area marks the aromatic rings responsible for fluorescence and the blue shade area marks the isothiocyanate group. (B) Steady-state absorption (solid lines) and emission (dashed lines) spectra of FITC and fluorescein adsorbed on silica beads. The green area marks (520 ± 5 nm) the excitation wavelength of the visible pulse, and the red area (585 ± 18 nm) marks the collection window of fluorescence signals in MD-WISE imaging. (C) DRIFTS spectra of FITC and fluorescein. Tuning the IR center frequency to 1600 cm–1 (green) or 2040 cm–1 (blue) excites the common vibrational modes of the xanthene ring or the isothiocyanate group unique to FITC, respectively. (D) Ultrafast kinetic traces of the relative difference of emission intensity in the widefield images induced by the IR pulse, measured using silica beads stained with FITC and fluorescein at 1600 and 2040 cm–1. (E) Responses of stained beads under different conditions. Left column is the fluorescence image of a single 3 μm bead without an IR pulse. The middle and right panels are the difference images at t = +1 ps acquired at 1600 and 2040 cm–1, respectively. All scale bars are 1 μm.
