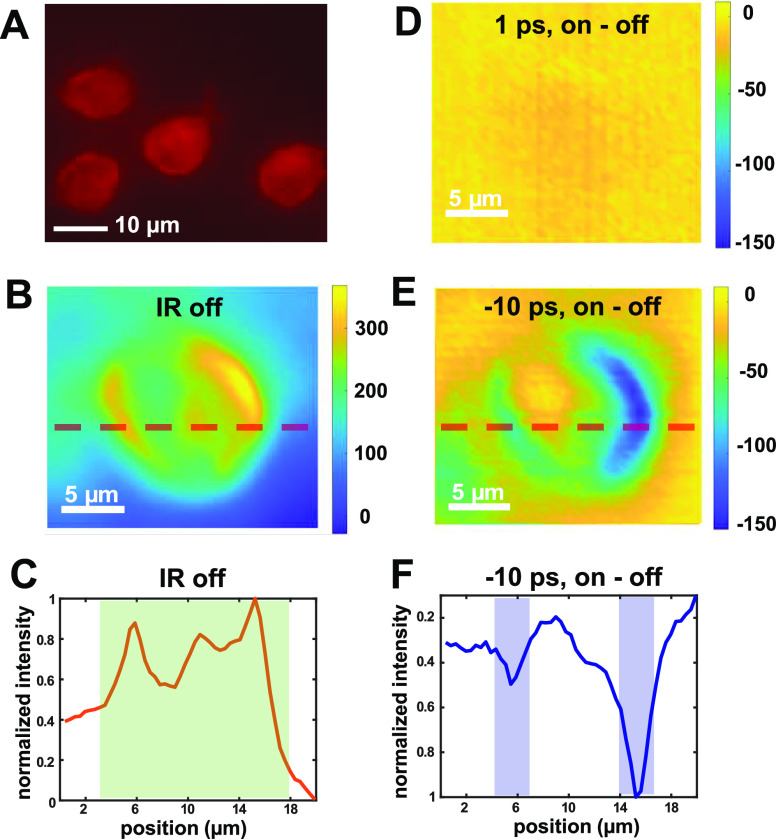
Figure 6.
Distinguishing QD-stained cellular membranes from PI-stained nucleic acids in a single cell by tuning the ultrafast delay between IR and visible pulses. The color bars represent the counts on CCD pixels. (A) Red-channel PL images of cells costained by both PI dyes and QDs. (B) MD-WISE image of a costained cell when IR pulse is blocked. The dashed horizontal line indicates the location where linecut intensity analysis was performed. (C) Normalized intensity plot aligned along the line in (B), showing signals throughout the cell (shaded area). (D) MD-WISE difference PL image with delay t set to 1 ps, showing no contrast for PI and QD stains. (E) MD-WISE difference PL image with delay t set to −10 ps, showing negative contrast for QD-stained membranes. The dashed horizontal line indicates the location where linecut intensity analysis was performed. (F) Normalized intensity plot aligned along the line in (E), showing signal peaks at the location of membranes (shaded area). All the MD-WISE images in panels B, D, and E were acquired using IR frequency centered at 2100 cm–1, visible excitation at 550 ± 5 nm, and PL collection wavelength range of 585 ± 18 nm.

