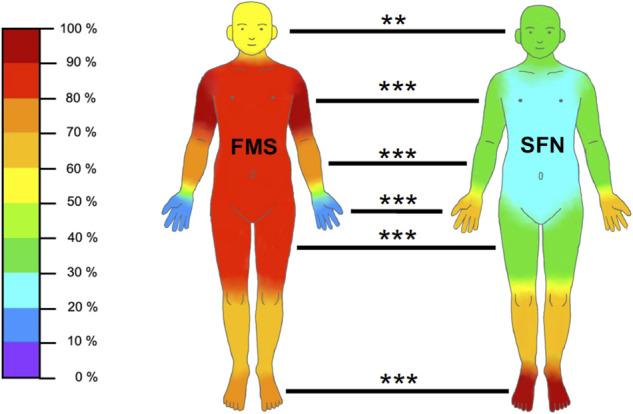
Figure 1.

Proportion of patients who reported pain in distinct body areas. The graph depicts the frequency of pain reported in distinct body areas in relation to the FMS (n = 158) and SFN (n = 53) patient groups. For exact data, please see Table 2. FMS, fibromyalgia syndrome; SFN, small fiber neuropathy. **P < 0.01, ***P < 0.001.
