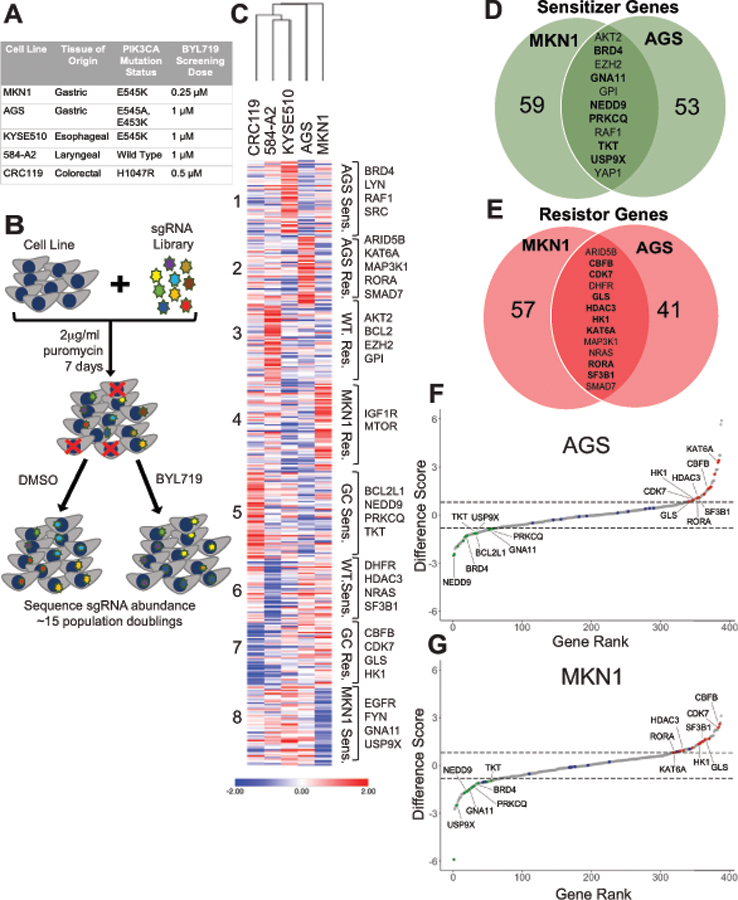
Figure 3: Application of CRISPR/Cas9-based screening method to identify modulators of BYL719 response.

(A) Description of the cell lines used in the screen with tissue of origin, PIK3CA mutation status, and BYL719 screening dose used. (B) Schematic representation of CRISPR/cas9 screening approach. (C) Heat map of difference scores generated using MAGeCK analysis pipeline. Hierarchical clustering of cell lines and K-means clustering of genes was completed using Morpheus. (D & E) Venn diagram showing common sensitizer and resistor genes between AGS and MKN1 cell lines. Genes specific to gastric cancer cell lines in bold. (F & G) Ribbon plots generated using difference scores for AGS and MKN cell lines. Sensitizer genes highlighted in green, resistor genes highlighted in red and controls highlighted in blue. Genes specific to gastric cancer cell lines labeled.
