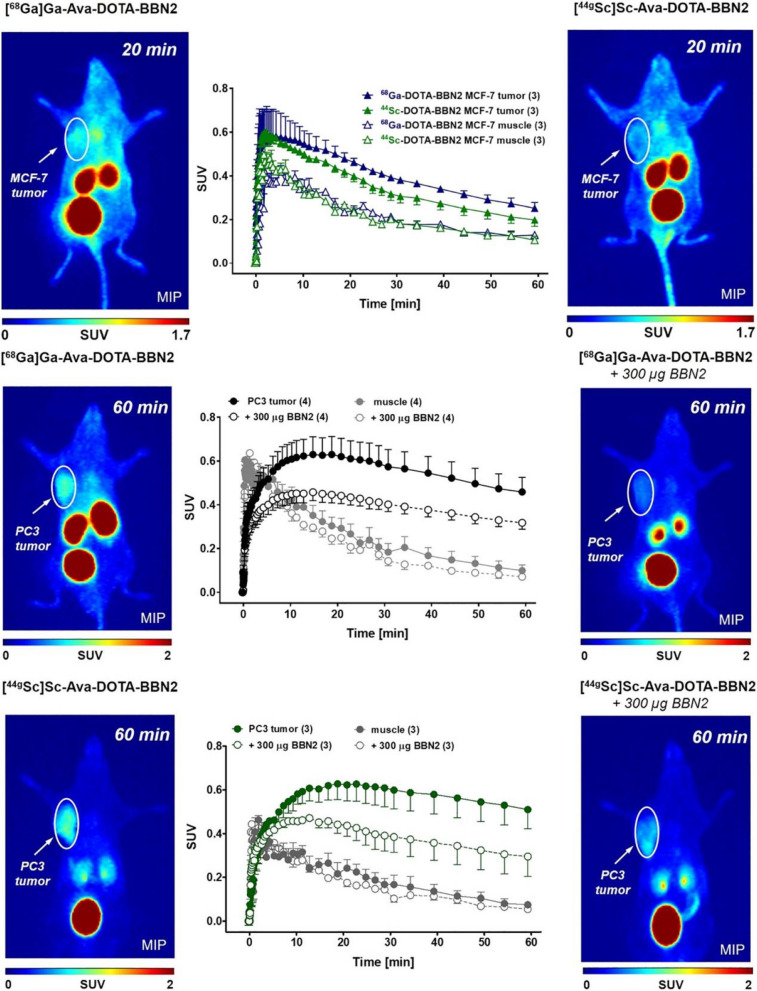
Fig. 6.
Representative PET images (MIP) of MCF7 tumor-bearing mice at 20 min after injection of 68 Ga-DOTA-Ava-BBN2 (left) and 44gSc-DOTA-Ava-BBN2 (right). Corresponding time-activity curves (middle) show the radioactivity levels in the tumor and muscle for both radiopeptides over time as SUV values (mean ± SEM from n = 3 experiments). Representative PET images (MIP) of PC-3 tumor-bearing mice at 60 min after injection of 68 Ga-DOTA-Ava-BBN2 (top) and 44gSc-DOTA-Ava-BBN2 (bottom) under control (right) and blocking conditions (left). Corresponding time-activity curves (middle) show the radioactivity levels in the tumor and muscle for both radiopeptides over time as SUV values (mean ± SEM from n = 3 experiments). With permission, from Ref. [77]

