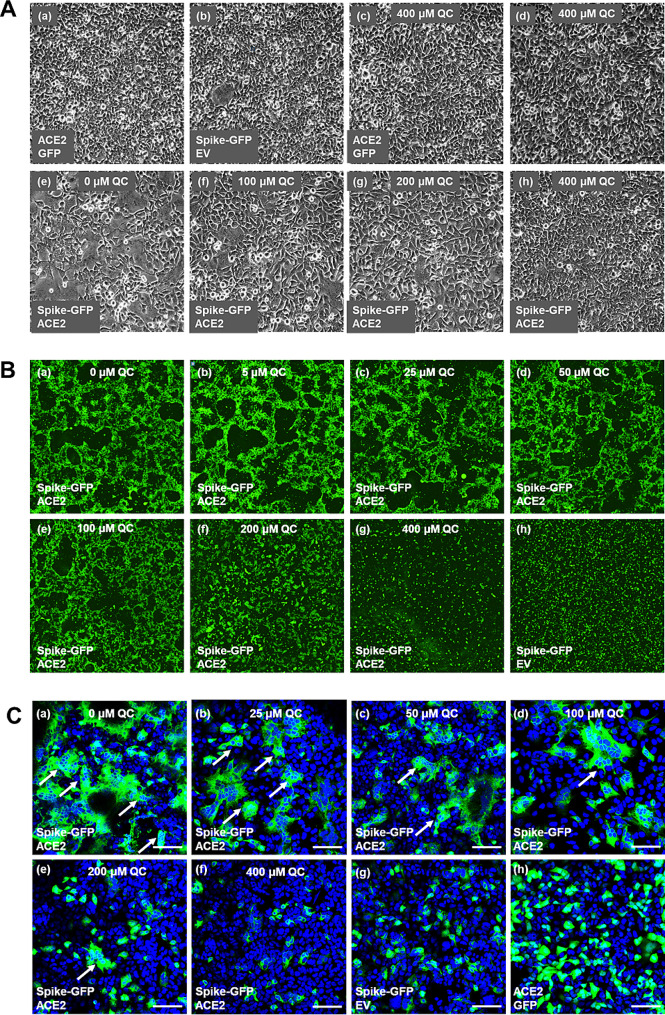
Fig. 2.
Microscopy of HEK293(S + ACE2) cell syncytialization and its inhibition by quercetin. (A) Brightfield microscopy. Controls cells (a-d) were transfected with plasmid vector for expression of indicated proteins and later cultured for 20 h in medium containing either DMSO (a, b) or 400 µM quercetin in DMSO. Experimental HEK293(S + ACE2) cells (e-h) were cultured for 20 h in medium containing either DMSO (e) or the indicated concentrations of quercetin (f-h). (B) Fluorescence microscopy. Control and experimental cells were treated as in A; GFP fluorescence was camera-captured in the Incucyte. (C) Confocal microscopy. Controls and experimental cells were treated as A, fixed, and stained with Hoechst. Images were captured. Arrows point to clusters of nuclei within region intense GFP fluorescence. Scale bar: 100 μm

