. 2023 Jan 19;25(1):1098612X221143769. doi: 10.1177/1098612X221143769
© The Author(s) 2023
This article is distributed under the terms of the Creative Commons Attribution-NonCommercial 4.0 License (https://creativecommons.org/licenses/by-nc/4.0/) which permits non-commercial use, reproduction and distribution of the work without further permission provided the original work is attributed as specified on the SAGE and Open Access pages (https://us.sagepub.com/en-us/nam/open-access-at-sage).
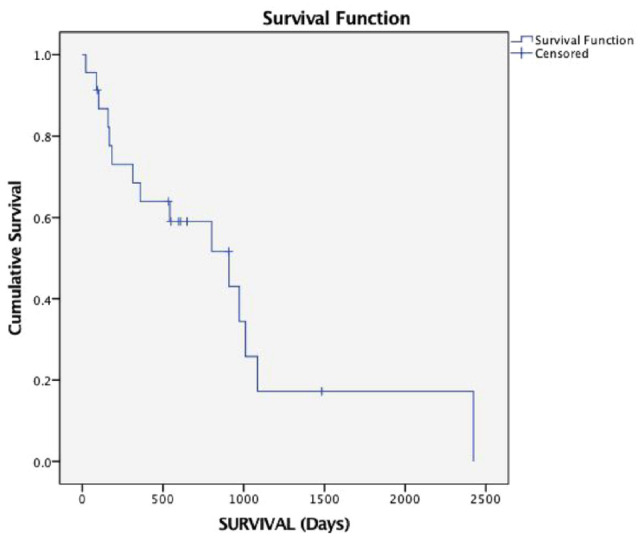
Figure 1.

Kaplan–Meier curve depicting survival time of all cats in the study
