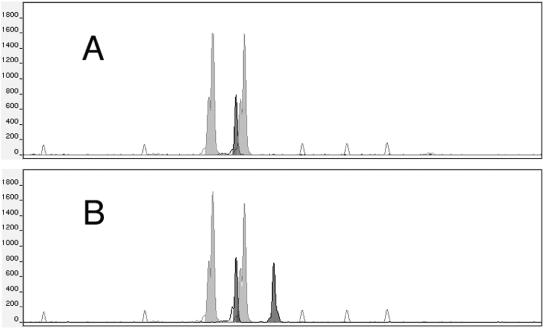
FIG. 1.
Electromorphs of the EF3 (black peaks) and CDC3 (gray peaks) microsatellite marker analysis of the Sor19 strain (A) and its original diploid CAF4-2 strain (B). The Sor19 strain monosomic for chromosome 5 has a single EF3 peak at 123 bp in contrast with the diploid original strain, which has two EF3 peaks at 123 and 132 bp. The empty peaks represent the internal size standards (from left to right: 75, 100, 139, 150, and 160 bp). The y axis shows fluorescence intensities in arbitrary units.

