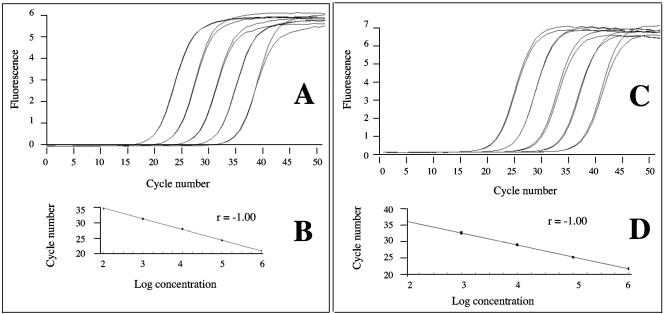
FIG. 2.
Amplification plots and standard curves obtained for EF3 gene dosage (A and B) and for CDC3 gene dosage (C and D) with a LightCycler instrument (Roche Molecular Biochemicals) with the use of SYBR Green I for online measurement of PCR products. (A and C) Serial 10-fold dilutions in water of CAF4-2 C. albicans strain DNA, diploid for both genes; the amplification curves shift to the right as the input target quantity is reduced. (B and D) Standard curves obtained by plotting the cycle number against the input target quantity. For a given C. albicans isolate, these standard curves were used to calculate the ratio N = starting copy number of EF3 gene/starting copy number of CDC3 gene.

