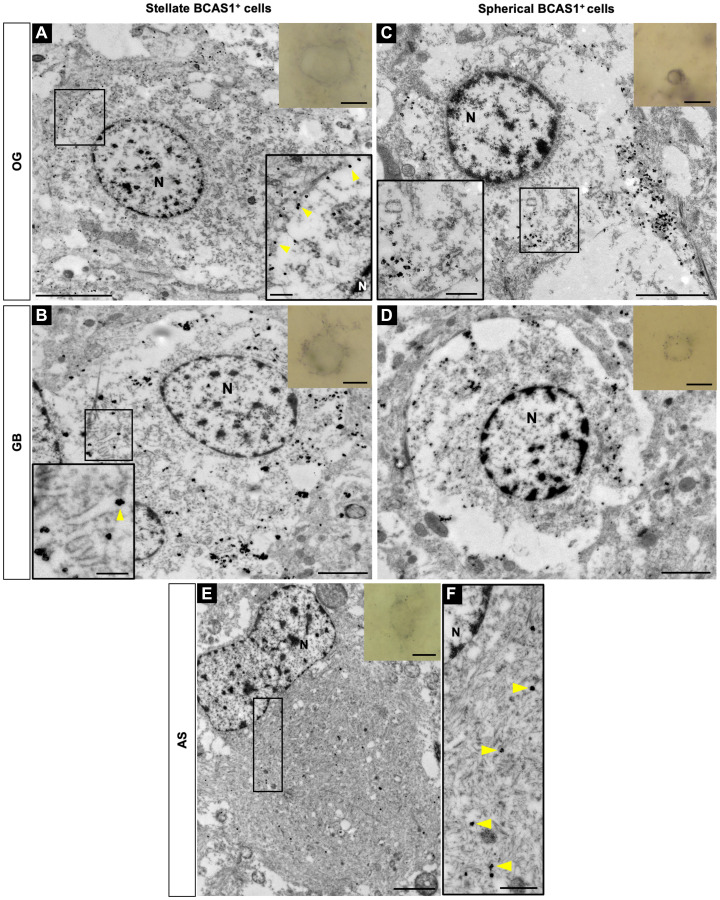
Figure 3. Subcellular localization of BCAS1 protein and ultrastructural features of BCAS1+ cells.
Transmission electron microscopy images of immuno-gold BCAS1-positive cells. Inserts in the right top corner are the optical microscope vision of the cells. (A) In OG, stellate cells are large, present abundant cytoplasm and loose chromatin. Magnification shows a detail of BCAS1 label in the plasma membrane (yellow arrowheads) and in close association with the abundant, short and dilated RER. (B) In GB, stellate cells share ultrastructural characteristics with those in OG. Magnification shows a detail of the BCAS1 label in RER (yellow arrowheads). (C) In OG, spherical cells have a small and round nucleus with a more condensed chromatin and present scarce cytoplasm. The subcellular BCAS1 location was also in the plasma membrane and in the RER. Magnification shows a detail of the BCAS1 label also in RER (yellow arrowheads). (D) In GB, spherical cells share ultrastructural characteristics with those in OG. (E) In AS, BCAS1-expressing cells present an irregular nucleus and an extensive cytoplasm with abundant intermediate filaments. (F) Magnification of the cytoplasm of a BCAS1+ cell in AS showing the subcellular location of BCAS1 label in the intermediate filaments (yellow arrowheads). n = 2 OG, n = 2 AS, n = 2 GB. N: nucleus. Scale bars: optical microscope vision) 5 μm; A, insert) 5 μm, 2 μm; B, insert) 2 μm, 500 nm; C, insert) 2 μm, 500 nm; D) 2 μm; E) 2 μm; F) 500 nm.

