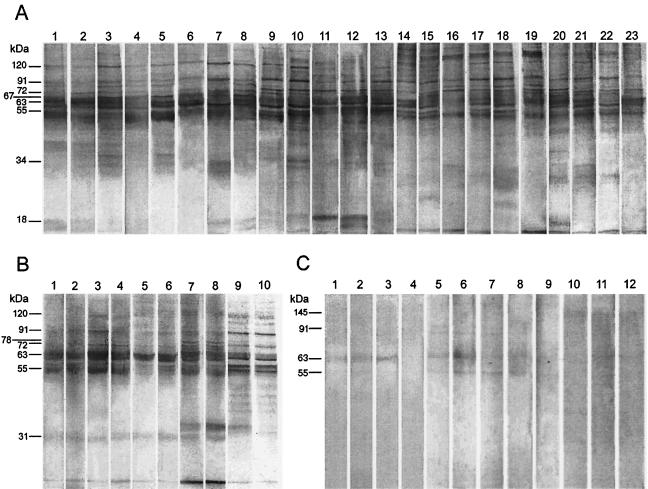
FIG. 2.
Western blot analysis of the IgG reactivities with SDS-PAGE-separated (6 μg/lane) membrane proteins of LAg of sera from patients with PKDL (A); kala-azar (VL) (B) before (odd-numbered lanes) and after (even-numbered lanes) treatment; and controls (C), including healthy controls (lanes 1 to 4), controls from areas of endemicity (lanes 5 to 8), and patients with leprosy (lanes 9 to 12). Each lane represents one serum sample. The molecular masses of the prominent bands are marked on the left.

