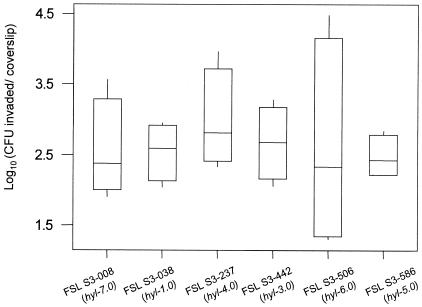
FIG. 5.
Box plot of HeLa cell invasion efficiency of three human S. agalactiae isolates and three bovine S. agalactiae isolates. Invasion phenotypes as shown on the y axis were measured as log10 (CFU invaded per coverslip). Values represent the medians and interquartile ranges from four independent experiments. Isolates tested are indicated on the x axis; isolates FSL-S3-008, FSL-S3-237, and FSL-S3-442 represent isolates from humans with invasive infections, and isolates FSL-S3-038, FSL-S3-506, and FSL-S3-586 were obtained from bovine hosts.

