FIGURE 1.
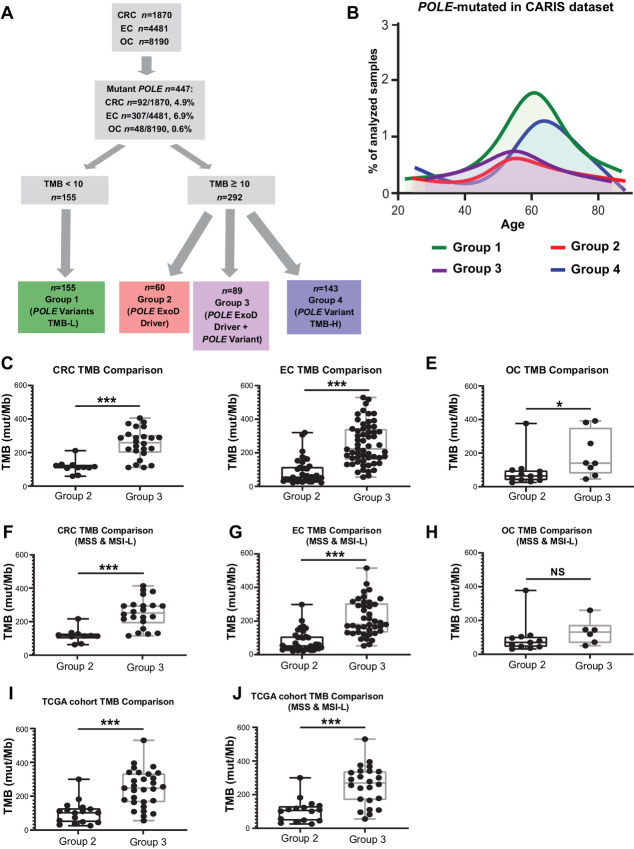
Characterization of POLE mutations in the CLS and TCGA dataset. A, Flowchart and analysis tree for colorectal cancer (CRC), endometrial cancer (EC), and ovarian cancer (OC) tumors by POLE mutations, TMB, and MSI/MSS status. Among 1,870 colorectal cancer, 4,481 endometrial cancers, and 8,910 ovarian cancer tumor genomic profiles, a total of 447 carried POLE mutations. Clinically relevant TMB cut-off points were used to define the TMB-H (≥10 mut/Mb) and TMB-L (<10 mut/Mb) cohorts. POLE mutation cohorts along with TMB and MSI/MSS status were defined. TMB-L tumors with POLE variants but no established POLE ExoD driver are referred to as “POLE Variants TMB-L” (Group 1, MSS or MSI). TMB-H tumors with known POLE ExoD driver only were referred to as “POLE ExoD Driver” (Group 2, MSS or MSI). TMB-H tumors with co-occurring POLE ExoD driver and POLE variant(s) were referred to as “POLE ExoD Driver + POLE ExoD Variant” (Group 3, MSS or MSI). TMB-H tumors with only POLE variant(s) and no POLE ExoD driver were referred to as “POLE Variant TMB-H” (Group 4, MSS or MSI). B, Age distribution of patients in the CLS cohort with POLE-mutated tumors (n = 447) designated as Group 1 (green), Group 2 (red), Group 3 (purple), and Group 4 (blue). mTMB comparisons between Group 2 and 3 colorectal cancers (C), endometrial cancers (D), and ovarian cancers (E). mTMB comparisons between Group 2 and 3 genomic profiles of colorectal cancer (F), endometrial cancer (G), and ovarian cancer (H). MSI-H tumor profiles were removed from this analysis. TCGA cohort mTMB comparisons between Group 2 and 3 tumors, in I MSI-H or MSS tumor profiles were included and in J only MSS tumor profiles were included. Because of smaller sample size per tumor type, analyses were pooled. A Mann–Whitney test was performed and ***, P < 0.001; *, P < 0.05; NS, nonsignificant.

