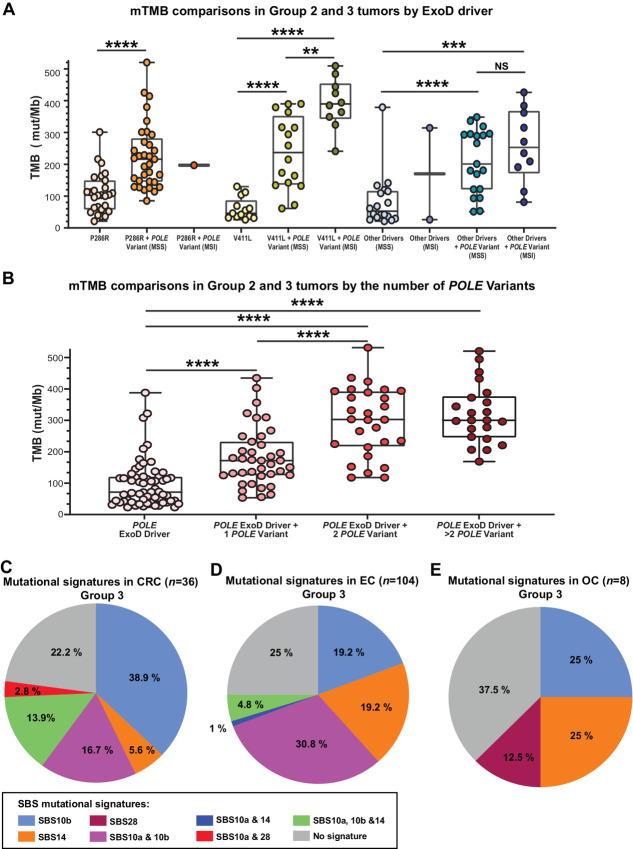
FIGURE 2.
A, mTMB comparisons in Group 2 and 3 tumors by ExoD driver alone [P286R, V411L, or other driver(s) combined] or in conjunction with POLE variants. Each filled round circle represents a tumor genomic profile; data are shown for the driver alone and/or plus POLE variant. Data in “other drivers” were combined because of lower numbers. The data are segregated for MSS or MSI status where relevant. A few statistical comparisons were not performed because of ≤2 datapoints. B, mTMB comparisons in Group 2 and 3 tumors by the increasing number of POLE variants. Data are combined analysis of colorectal cancer, endometrial cancer, and ovarian cancer genomic profiles in the Caris dataset. Each filled round circle represents a tumor genomic profile; data are shown for Group 2 ExoD drivers, and for Group 3 by the ExoD driver plus the number of variants [1, 2, and >2 variant(s)]. A and B, A Mann–Whitney test was performed and ****, P < 0.0001; ***, P < 0.001; **, P < 0.01; NS, nonsignificant. Corrections for multiple comparisons were performed using the Benjamini–Hochberg FDR test. C–E, 3-nucleotide context of POLE variants in Group 3 tumors. All COSMIC mutational signatures associated with POLE ExoD driver defects (SBS 10a, SBS 10b, SBS 14, and SBS 28) were assessed (39). Pie chart distribution of SBS 10a, SBS 10b, SBS 14, and SBS 28 in colorectal cancer (C), endometrial cancer (D), and ovarian cancer (E). Each of these signatures has a primary mutation which has been described as a “hotspot” (39); SBS 10a is C>A in TCT context; SBS 10b is C>T in the TCG context; SBS 14 is C>A in the NCT context (N is any base); and SBS 28 is T>G in the TTT context. In addition to these primary “hotspots,” all mutations that comprise >1% of the genome signature of interest were counted, capturing 88%–90% of each signature in the analysis.

