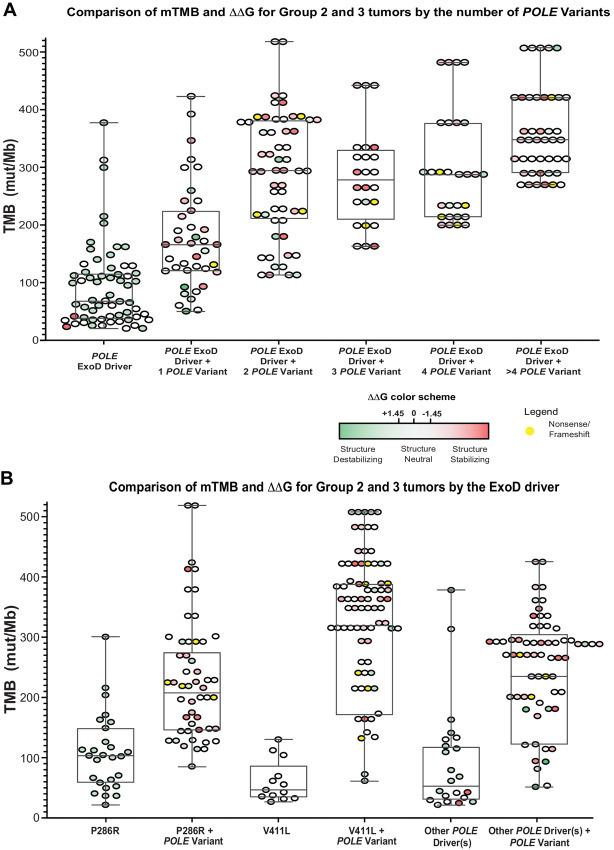
FIGURE 4.
Comparison of mTMB and ΔΔG values in Group 2 and 3 tumors in the CLS dataset. With AF2 DNA unbound model and Rosetta ddG_monomer, we generated 25 repacked decoys for each mutation and compared the average energy score for these decoys with an average for 25 decoys of the WT protein. For mutations in the NTL, we performed calculations on both models (with and without DN). For those in the CTL, we performed calculations only on the DNA unbound model. We used a cutoff of ±1.45 kcal/mol for significant ΔΔG, corresponding to approximately 3 SDs of the differences of the mean Rosetta scores for WT and mutant structures. A, Comparison of mTMB and ΔΔG values in Group 2 and Group 3 tumors by the number of POLE variants. Data for colorectal cancer, endometrial cancer, and ovarian cancer genomic profiles were combined, and ΔΔG values were plotted against the mTMB. For Group 2 or 3 data with + 1 POLE variant plots, each filled round circle represents a single tumor genomic profile. B, Comparison of mTMB and ΔΔG values in Group 2 and Group 3 tumors by POLE ExoD driver. Data for colorectal cancer, endometrial cancer, and ovarian cancer genomic profiles were combined, and ΔΔG values were plotted against the mTMB. A and B, Group 3 tumors with multiple variants, a circle next to another circle (without any space) represents a single tumor. For clarity, ΔΔG values for ExoD drivers in Group 3 tumors are not shown (they are same as in Group 2). Color in each filled circle—green and shades of green, structure-destabilizing variants (positive ΔΔG); white, variants that are within the SDs of ±1.45 kcal/mol and are structure neutral; red and shades of red, structure-stabilizing variants (negative ΔΔG). Yellow, nonsense, or frameshift variants.

