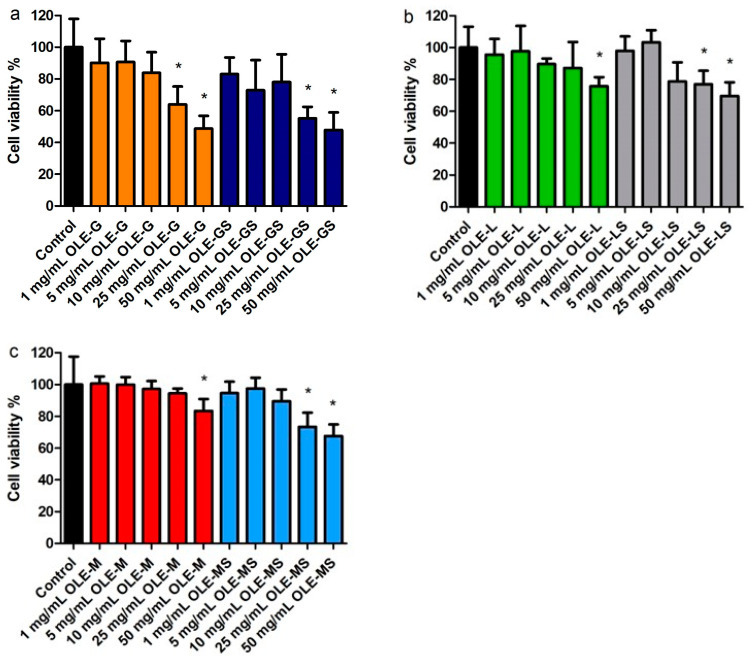
Figure 4.
HUVEC viability after 4 h of incubation with (a) OLE-G and OLE-GS, (b) OLE-L and OLE-LS, and (c) OLE-M and OLE-MS in culture medium. Data are expressed as % viable cells in reference to 100% control (untreated cells). Data are reported as mean ± SD (n = 6). *, Significantly different from control (p < 0.05).

