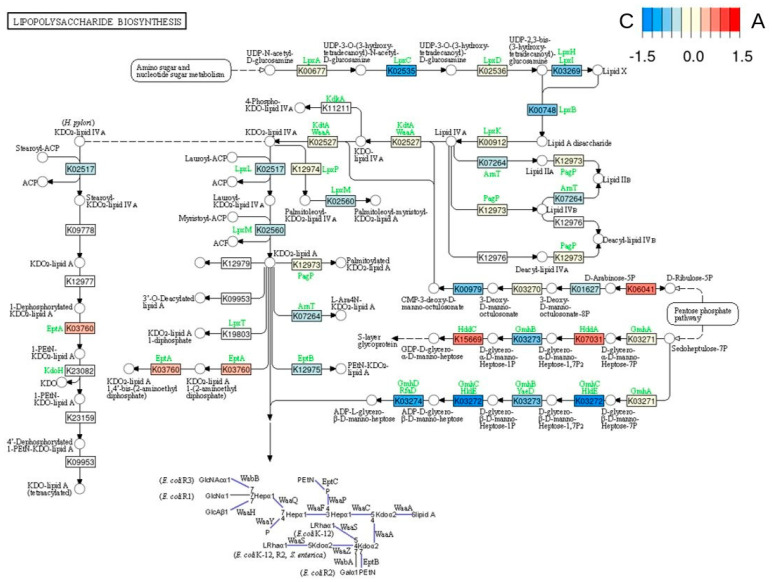
Figure A3.
Lipopolysaccharide biosynthesis metabolic pathway heatmap with log 2 fold-change values of the comparison between CTR (C) and BRA (A) diet. Blue means overabundance of the gene in the CTR group, and red means overabundance in the BRA group. C (CTR)—control diet low in TDF (5.7%); A (BRA)—diet enriched with fiber from cereals (12.0% TDF).

