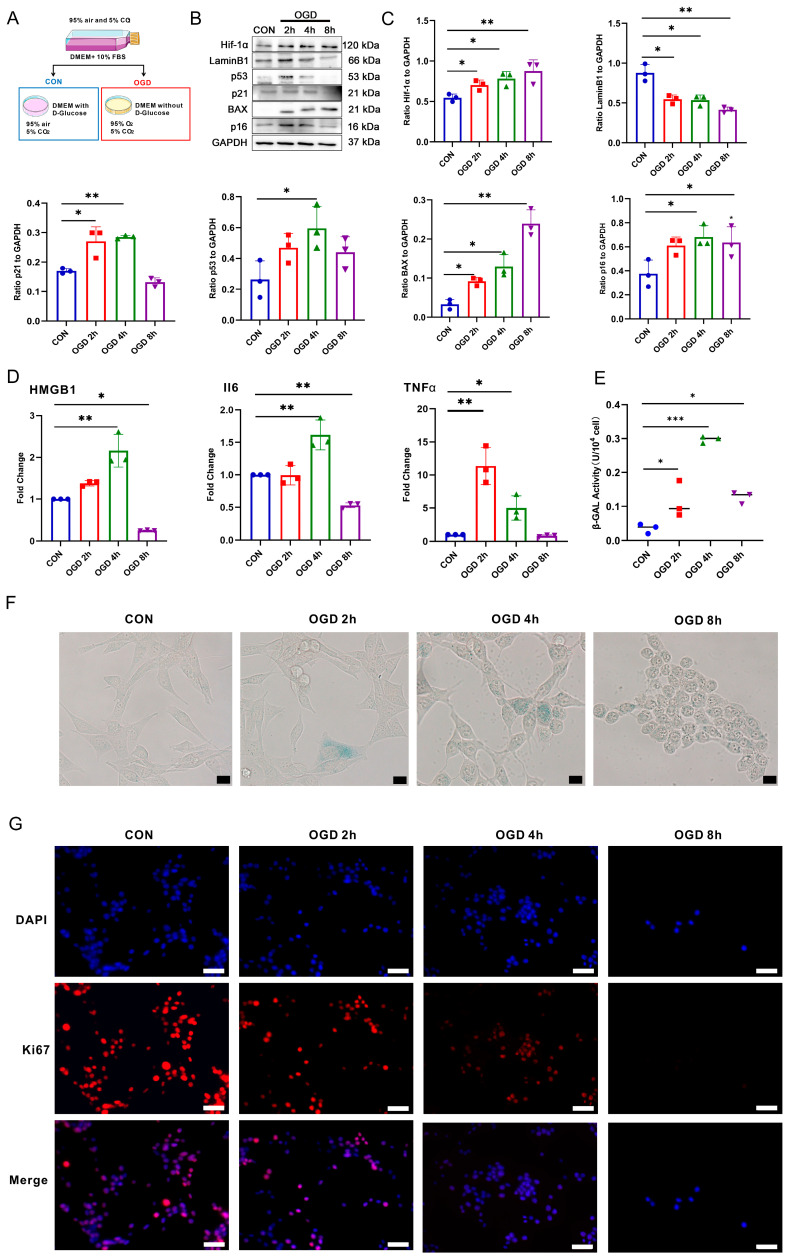
Figure 2.
Effects of different duration of OGD on the fate of fibroblasts. (A) Cell grouping and treatment diagram. (B) Western blot analysis of Hif-1α, Lamin B1, p53, p21, p16, and BAX in NIH3T3 cells. (C) Quantification of (B). * p < 0.05, ** p < 0.01 compared with the CON group. (D) RT-qPCR analysis of HMGB1, IL6, and TNFα mRNA in NIH3T3 cells. * p < 0.05, ** p < 0.01 compared with the CON group. (E) β-galactosidase (β-GAL) activity analysis in NIH3T3 cells. * p < 0.05, *** p < 0.001 compared with the control group. (F) β-GAL staining of NIH3T3 cells. Scale bar = 50 μm. (G) Cell proliferation was detected using Ki67 staining. The red fluorescence in the image indicates the Ki67 positive cells, while the blue fluorescence indicates the nucleus. Scale bar = 50 μm.

