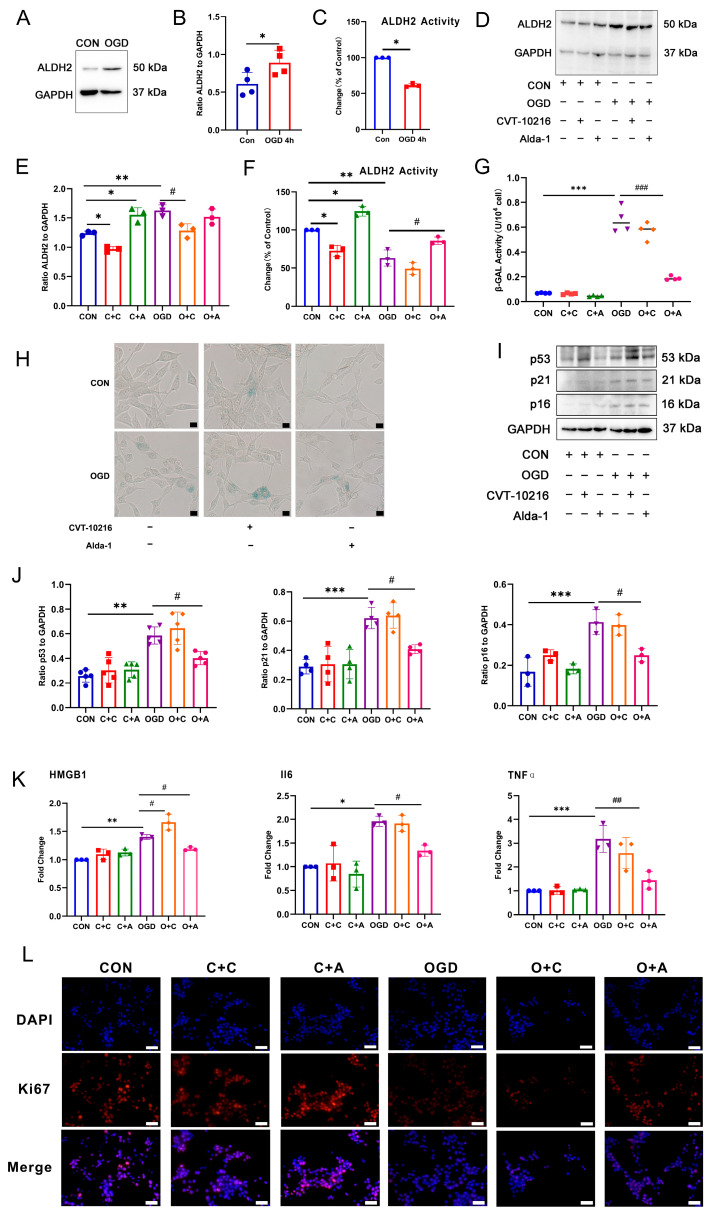
Figure 4.
The effect of ALDH2 activity on fibroblast senescence after OGD. (A) Western blot analysis of ALDH2 in NIH3T3 cells. (B) Quantification of (A). * p < 0.05 compared with the CON group. (C) Changes in ALDH2 activity in NIH3T3 cells after OGD. * p < 0.05 compared with the CON group. (D). Western blot analysis of ALDH2 in NIH3T3 cells. (E) Quantification of (D). * p < 0.05, ** p < 0.01 compared with the control group, # p < 0.05 compared with the OGD group. (F) Changes in ALDH2 activity in NIH3T3 cells with the agonist/inhibitor treatment. * p < 0.05, ** p < 0.01 compared with the CON group, # p < 0.05 compared with the OGD group. (G) β-GAL activity analysis in NIH3T3 cells with the agonist/inhibitor treatment. *** p < 0.005 compared with the CON group, ### p < 0.001 compared with the OGD group. (H) β-GAL staining in NIH3T3 cells with the agonist/inhibitor treatment. Scale bar = 50 μm. (I) Western blot analysis of p53, p21, and p16 in NIH3T3 cells. (J) Quantification of (I). ** p < 0.01, *** p < 0.001 compared with the CON group, # p < 0.05 compared with the OGD group. (K) RT-qPCR analysis of IL6, HMGB1 and TNFα mRNA in NIH3T3 cells. * p < 0.05, ** p < 0.01, *** p < 0.001 compared with the CON group, # p < 0.05, ## p < 0.01 compared with the OGD group. (L) Cell proliferation was detected using ki67 staining. The red fluorescence in the image indicates the Ki67 positive cells, while the blue fluorescence indicates the nucleus. Scale bar = 50 μm. C + C: CON + CVT-10216, C + A: CON + Alda-1, O + C: OGD + CVT-10216, O + A: OGD + Alda-1.

