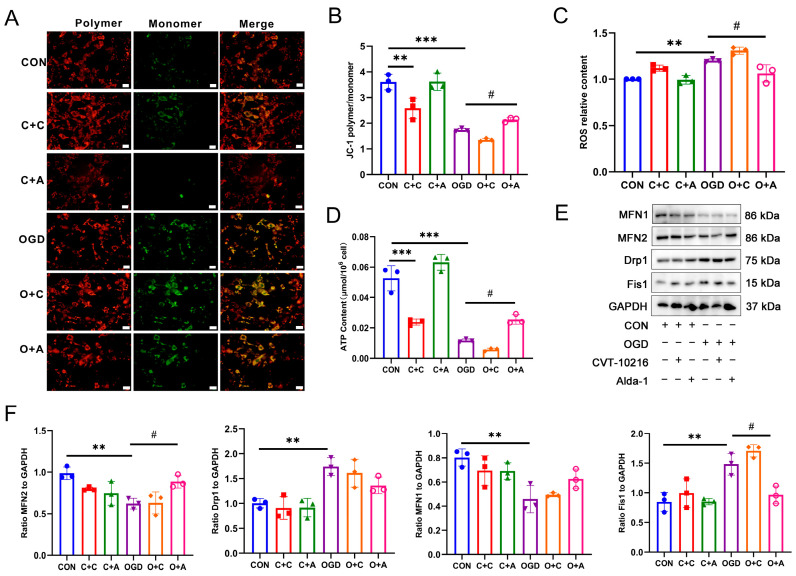
Figure 5.
Effect of ALDH2 activity on mitochondrial damage induced by OGD. (A) Mitochondrial membrane potential was detected using JC-1 staining. The red fluorescence indicates the JC-1 polymer and the green fluorescence indicates the JC-1 monomer. Scar bar = 50 μm. (B) Quantification of (A). ** p < 0.01, *** p < 0.001 compared with the CON group, # p < 0.05 compared with the OGD group. (C) ROS relative content in NIH3T3 cells. ** p < 0.01 compared with the CON group, # p < 0.05 compared with the OGD group. (D) ATP content in NIH3T3 cells. *** p < 0.001 compared with the CON group, # p < 0.05 compared with the OGD group. (E) Western blot analysis of MFN1, MFN2, Drp1, and Fis1 in NIH3T3 cells. (F) Quantification of (E). ** p < 0.01 compared with the CON group, # p < 0.05 compared with the OGD group. C + C: CON + CVT-10216, C + A: CON + Alda-1, O + C: OGD + CVT-10216, O + A: OGD + Alda-1.

