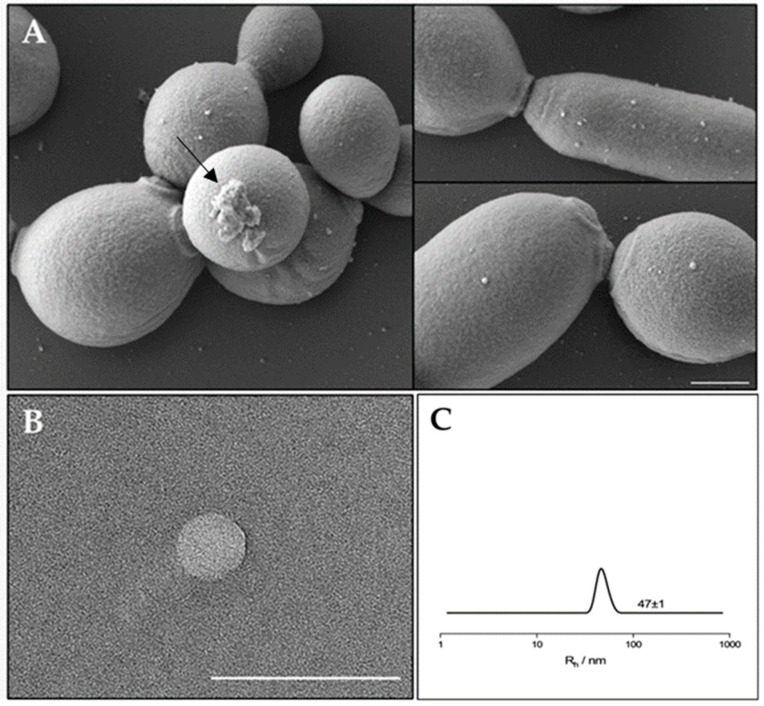
Figure 1.
(A) SEM visualization of C. albicans biofilm showing EVs on the surface. The arrow indicates a residue of extracellular matrix of the biofilm. Bar corresponds to 1 mm. (B) TEM photograph of an isolated extracellular vesicle from C. albicans biofilm. Bar corresponds to 200 nm. (C) Hydrodynamic radius distribution of an EVs suspension in PBS.

