
Figure 1.
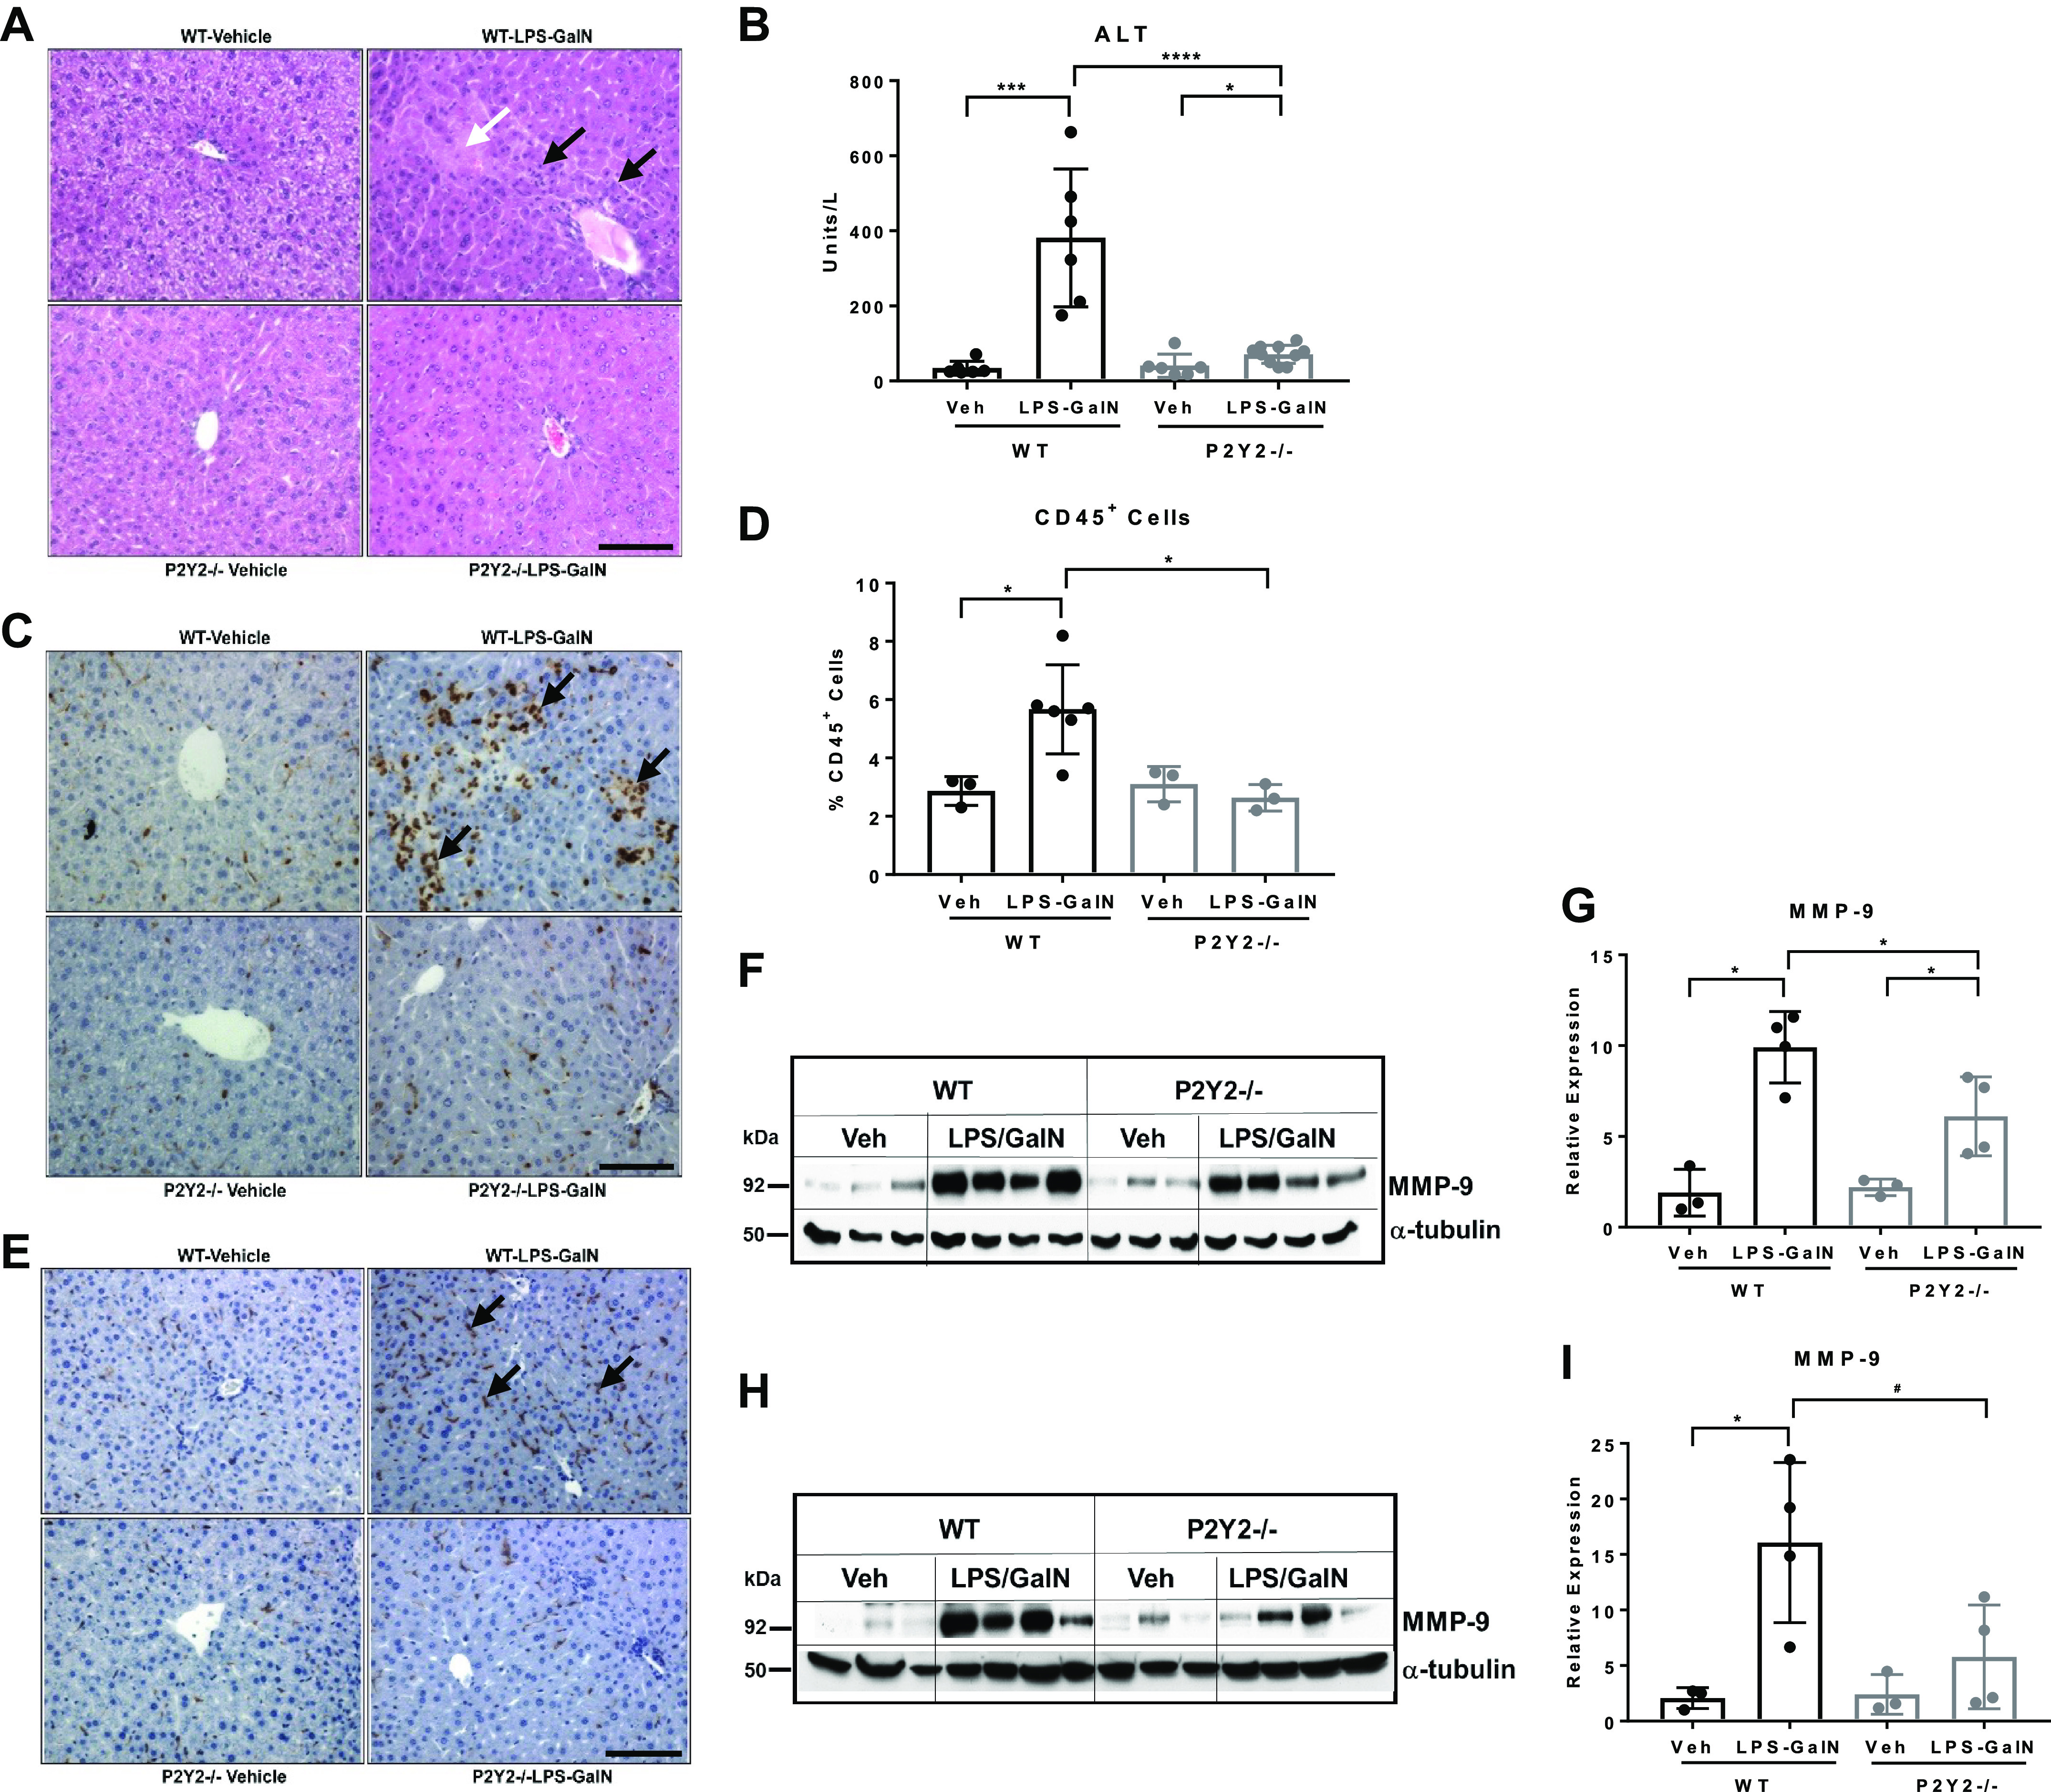
LPS/GalN-mediated acute liver injury is attenuated in P2Y2−/− mice. WT and P2Y2−/− mice treated with LPS (100 µg/kg) and galactosamine (GalN, 700 mg/kg) or saline (Veh) for 1 and 5 h. A: representative H&E-stained liver sections (×20 field of view). White arrow points to the necrotic lesion and black arrows point to leukocyte infiltration within hepatic parenchyma. Black scale bar, 100 µm. B: serum ALT (n, WT-Veh, 5, WT-LPS/GalN, 5; P2Y2-Veh, 7; P2Y2-LPS/GalN, 11). C: representative liver sections stained for CD45+ leukocytes (×20 field of view). Black arrows point to leukocyte infiltration within hepatic parenchyma. Black scale bar, 100 µm. D: quantified by a stereological method at ×60 magnification by observers blinded to treatment groups. Bar diagram represents the analysis of 15 fields of view in each liver section (n, WT-Veh, 3, WT-LPS/GalN, 6; P2Y2-Veh, 3; P2Y2-LPS/GalN, 3). E: representative F4/80-stained liver sections (×20 field of view). Black arrows point to macrophage infiltration. Black scale bar, 100 µm. Total protein extracts of livers harvested at 1 h (F–G) and 5 h (H–I) post-LPS-GalN were analyzed by Western blotting with antibodies specific for MMP-9 and α-tubulin (protein loading control; n, WT-Veh, 3, WT-LPS/GalN, 4; P2Y2-Veh, 3; P2Y2-LPS/GalN, 4). Bar diagrams represent relative expression. Means ± SD, *P < 0.05, ***P < 0.001, ****P < 0.0001, #P = 0.05. n, number of biological replicates. Veh, vehicle.