Figure 3.
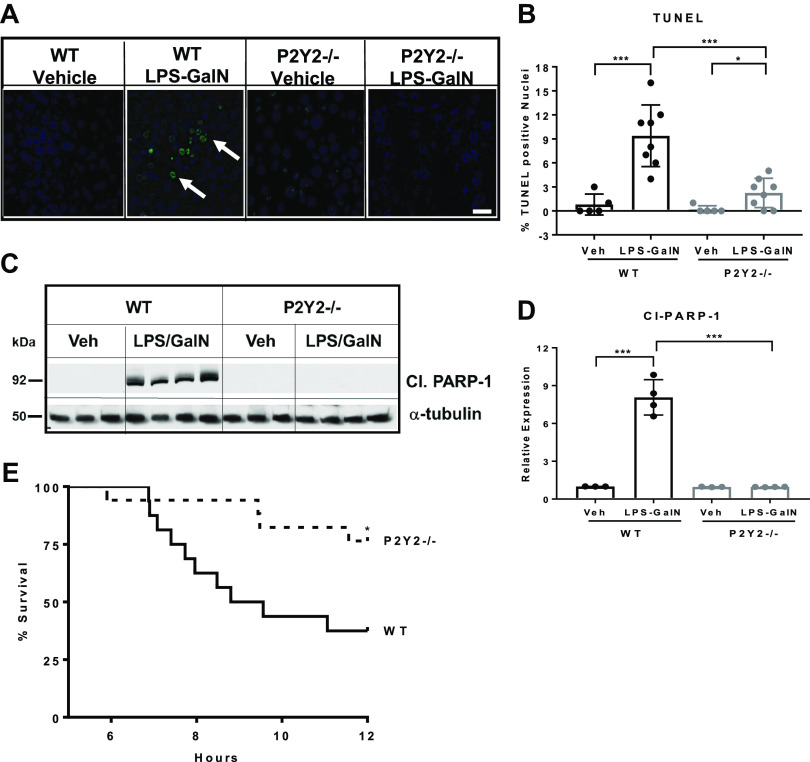
LPS/GalN-mediated induction of hepatocyte apoptosis is attenuated in P2Y2−/− mice. A: representative images of liver sections after TUNEL staining (×40 field of view; 5 h post-LPS/GalN). White arrows, apoptotic nuclei. White scale bar, 50 µm. B: bar diagram represents the percentage of TUNEL-positive nuclei, based on the analysis of 10 fields of view (×40) in each liver section (n, WT-Veh, 5, WT-LPS/GalN, 8; P2Y2-Veh, 5; P2Y2-LPS/GalN, 8). C and D: total protein extracts of livers harvested at 5 h post-GalN/LPS were analyzed by Western blotting for Cleaved PARP-1 and α-tubulin (protein loading control). Bar diagram represents relative expression (n, WT-Veh, 3; WT-LPS/GalN, 4; P2Y2-Veh, 3; P2Y2-LPS/GalN, 4). E: Kaplan–Meier curve representing percentage survival of WT vs. P2Y2−/− after LPS/GalN treatment (n, 16–17). Means ± SD, *P < 0.05, ***P < 0.001. n, number of biological replicates.

