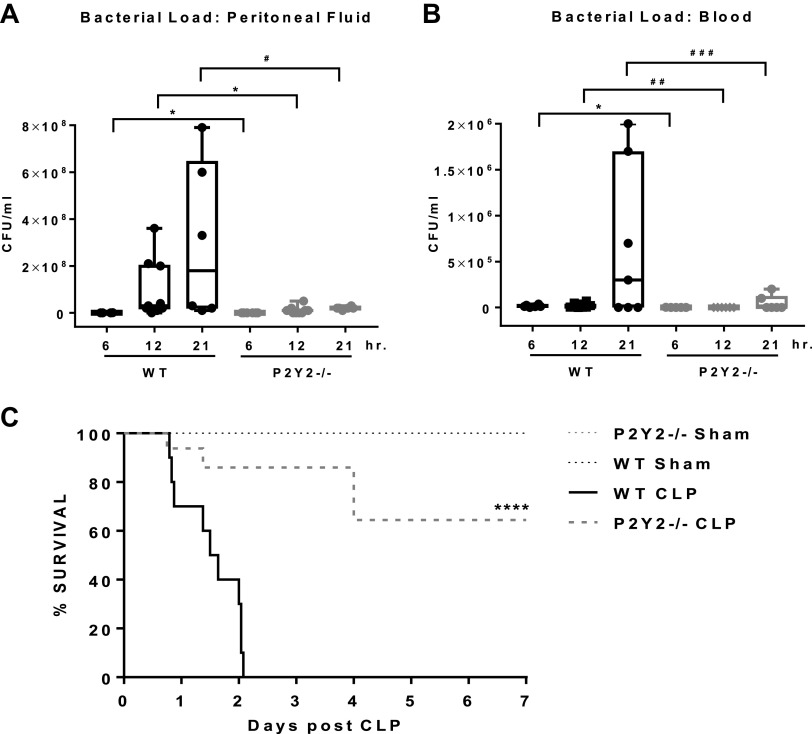
Figure 8.
Bacterial translocation, bacteremia, and mortality are attenuated in P2Y2−/−. Comparison of bacterial load expressed in colony-forming units per milliliter (CFU/mL) in peritoneal lavage fluid (A) and blood (B) at 6, 12, and 21 h post-CLP. (Peritoneal lavage fluid: n, WT, 4–9; P2Y2−/−, 6–10; Blood: n, WT, 6–8; P2Y2−/−, 5–8.) Data are represented by Box and Whisker plots, *P < 0.05, #P = 0.07, ##P = 0.06, ###P = 0.10. C: Kaplan–Meier 7-day survival curves. Log-rank (Mantel-Cox) analysis ****P < 0.0001 (n, WT-sham, 6, WT-CLP, 10; P2Y2-Sham, 6, P2Y2-CLP, 10). n, number of biological replicates. CLP, cecal ligation and puncture; WT, wild type.

