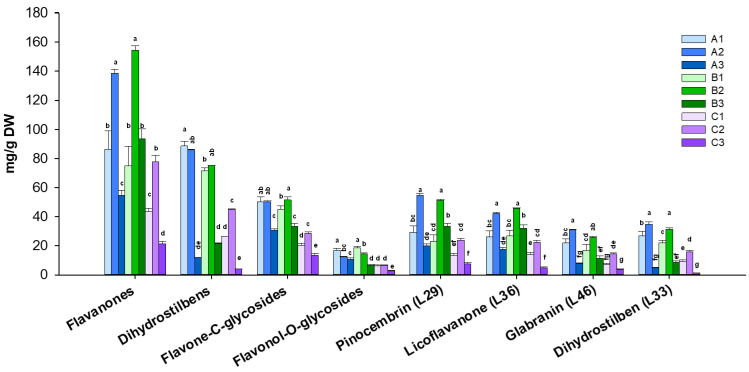
Figure 2.
Levels of metabolite classes and the most abundant compounds from three production areas (P) and three harvest times (HT) of G. glabra leaves. Different letters within each metabolite class or compound indicate significant differences between extracts (p ≤ 0.05 by a post-hoc Tukey’s HSD test).

