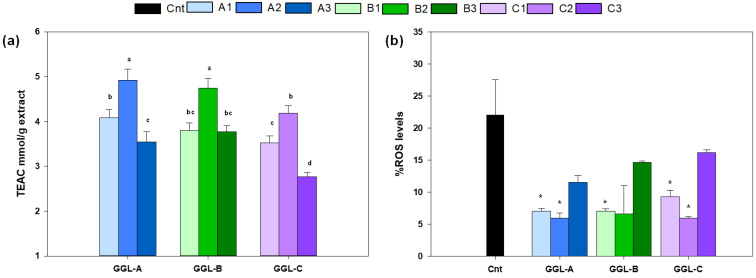
Figure 3.
Antioxidant capacity of G. glabra leaf extracts from three production areas and three harvest times, measured as (a) TEAC equivalents by ABTS assay and (b) ROS content (assayed by DHE staining) of yeast cells BY4742 bearing pYX242-SNCA plasmid grown in minimal medium containing 2% glucose for 24 h in the absence (cnt) or presence of 0.2% G. glabra leaf extracts. Different letters in (a) indicate significant differences between extracts (p ≤ 0.05 by Tukey’s HSD test). * p < 0.05 relative to control cells. Data of (b) represent mean and standard deviation of at least two independent experiments.

